Disclaimer: This article is for educational and informational purposes only. It does not constitute financial or investment advice. Trading forex and CFDs carries significant risk of loss. Past performance of any strategy — including backtests — does not guarantee future results. Never trade with money you cannot afford to lose.
What Is This Strategy?
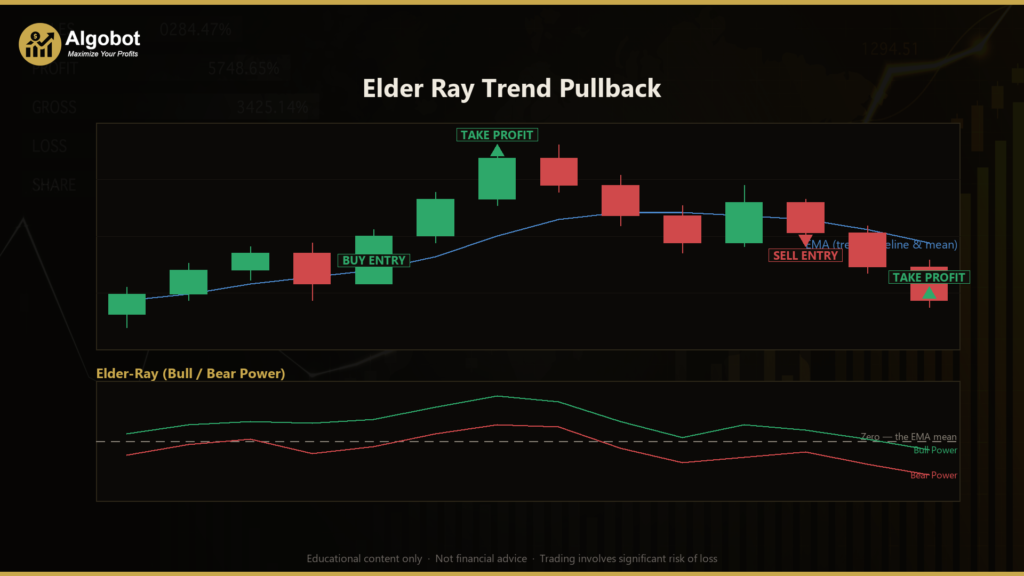
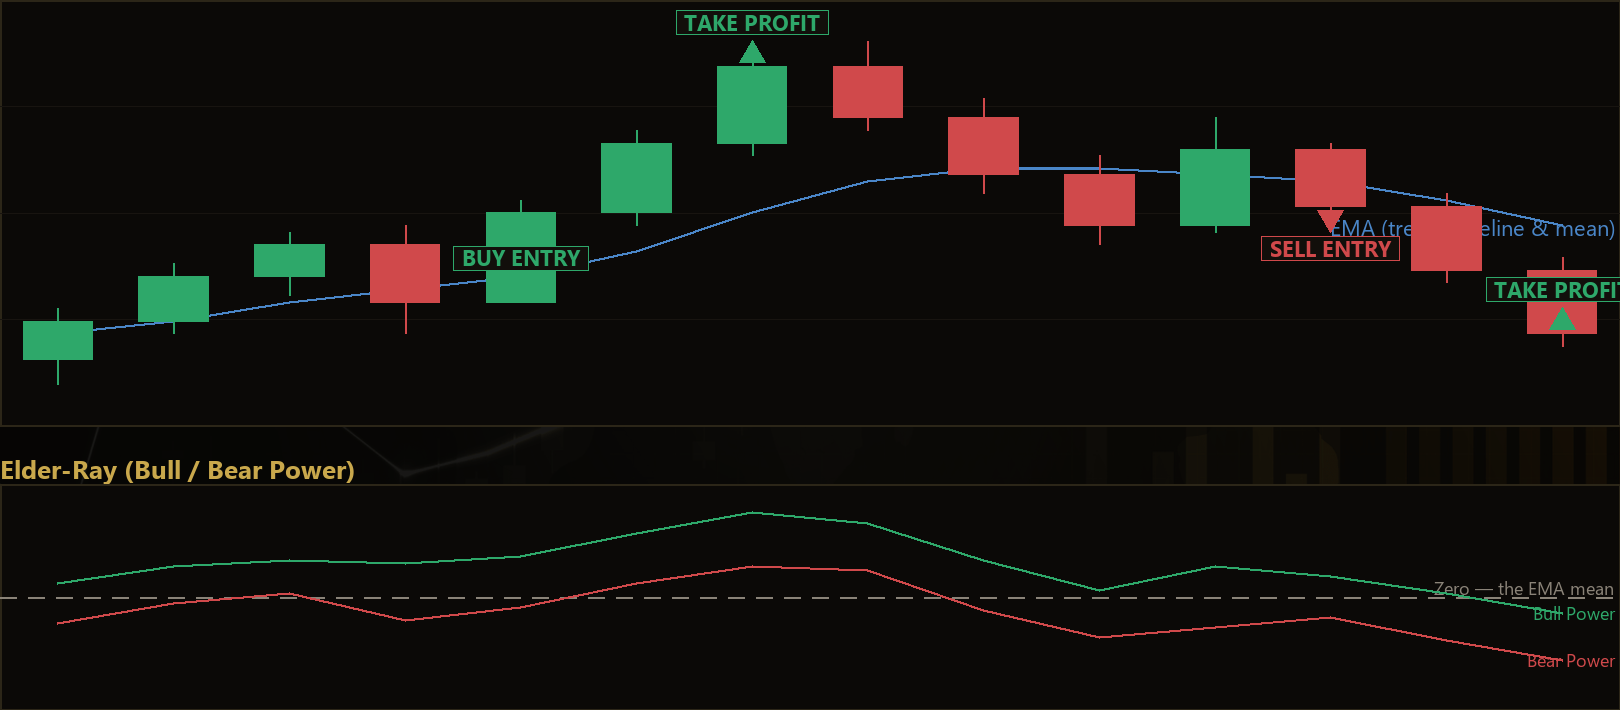
The Elder Ray Trend Pullback strategy is a trend-following pullback system built on Dr. Alexander Elder's Elder-Ray oscillator, a momentum tool that measures how far buyers and sellers push price away from a moving-average "mean." Rather than chasing breakouts, this strategy waits for a temporary give-back against the prevailing trend and then joins the move as it resumes — the classic "buy the dip, sell the rally" approach expressed through Elder-Ray's Bull Power and Bear Power readings.
What makes this implementation distinctive is that it follows the spirit of Elder's Triple-Screen method by hanging both the trend filter and the entry oscillator off a single exponential moving average (EMA) of the closing price. The EMA slope defines the trend direction, and the same EMA becomes the reference line for Elder-Ray. Bull Power is the bar's high minus the EMA (how far bulls pushed above the mean), while Bear Power is the bar's low minus the EMA (how far bears pushed below it). Because only one baseline drives every decision, the logic stays internally consistent and easy to reason about.
This is designed as a learning tool for traders who want to study pullback entries within an established trend. It is symmetric — it trades both long and short — and was conceived with trending FX majors and metals (such as EUR/USD or XAU/USD) on intermediate timeframes in mind. If you are exploring how oscillators and trend filters can be combined without over-engineering, this strategy is a clean, well-commented example to analyze. It is not a shortcut of any kind; it is a structured way to understand disciplined trend-continuation logic.
How It Works
The strategy evaluates its rules once per newly closed bar and acts only on completed price data. Here is how the pieces fit together.
The trend gate (EMA slope):
- The strategy calculates an EMA of closing prices over
EmaPeriodbars. - It compares the current EMA value to the EMA value
SlopeLookbackbars earlier. - Uptrend = the EMA is now higher than it was
SlopeLookbackbars ago. - Downtrend = the EMA is now lower than it was
SlopeLookbackbars ago. - If the EMA is essentially flat (neither condition holds), no trade is considered.
The long entry (buying a dip in an uptrend) — the strategy signals a long when all of these are true:
- The trend gate reports an uptrend.
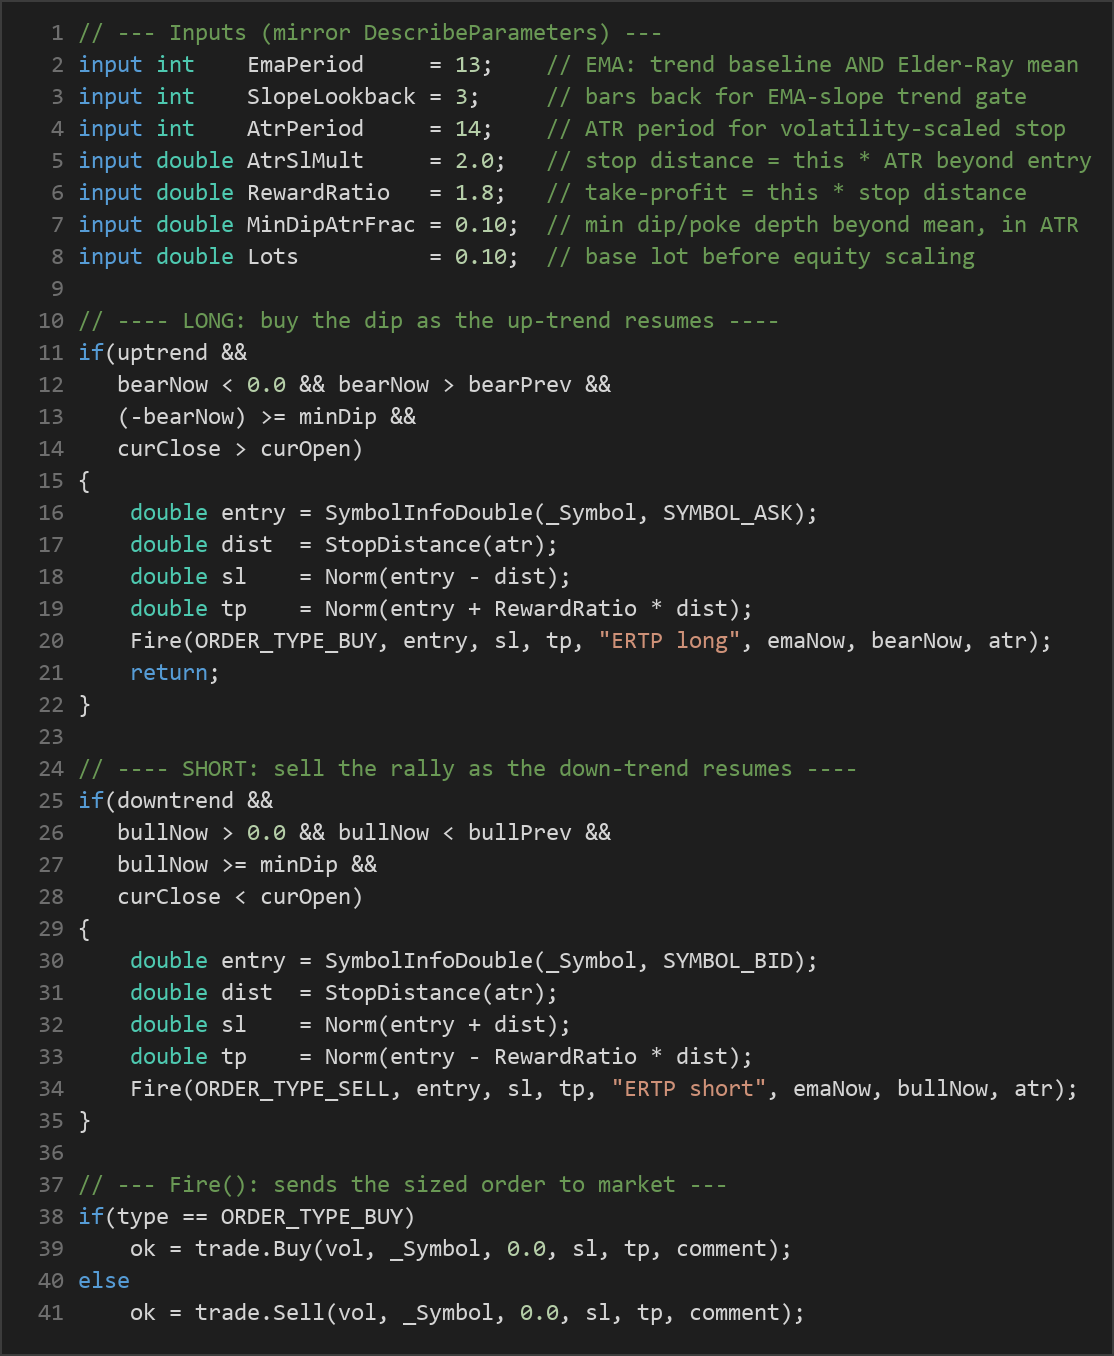
- Bear Power (the just-closed bar's low minus the EMA) is negative — price genuinely dipped below the mean.
- Bear Power has turned up versus the previous bar, meaning sellers are losing their grip as the dip recovers.
- The dip is at least
MinDipAtrFrac× ATR deep, so trivial noise is filtered out. (ATR, the Average True Range, is a common volatility measure.) - The bar closes bullish (close above open), confirming upside resumption.
The short entry (selling a rally in a downtrend) — the mirror image:
- The trend gate reports a downtrend.
- Bull Power (the just-closed bar's high minus the EMA) is positive — price genuinely poked above the mean.
- Bull Power has turned down versus the previous bar, meaning buyers are fading.
- The poke is at least
MinDipAtrFrac× ATR tall. - The bar closes bearish (close below open), confirming downside resumption.
Stop-loss logic:
- The stop distance is
AtrSlMult× ATR placed beyond the entry price. Because it scales with volatility, the stop widens in fast markets and tightens in calm ones instead of using a fixed pip count. - The distance is floored at the broker's minimum allowed stop level so orders remain valid.
Take-profit logic:
- The target is set at
RewardRatio× the stop distance, producing a fixed, predefined reward-to-risk ratio on every trade.
Trade management:
- Only one position per magic number is held at a time. Once a trade is open, the ATR stop and the reward target manage the exit — there is no averaging in or manual meddling.
- Position size uses fixed-fractional sizing: the base lot is scaled by the ratio of live equity to the equity captured at start-up, so exposure grows only as the account grows and contracts through drawdowns. The scale is clamped between 0.25× and 4× to limit tail exposure, then normalized to the symbol's volume step, minimum, and maximum.
Strategy Parameters
| Parameter | Default | Min | Max | Description |
|---|---|---|---|---|
EmaPeriod |
13 | 8 | 40 | Length of the EMA that serves as both the trend baseline and the Elder-Ray reference mean. |
SlopeLookback |
3 | 1 | 10 | Number of bars back used to measure EMA slope for the trend gate. |
AtrPeriod |
14 | 5 | 30 | ATR period used to size the volatility-scaled stop. |
AtrSlMult |
2.0 | 0.5 | 5.0 | Stop distance as a multiple of ATR placed beyond the entry. |
RewardRatio |
1.8 | 0.5 | 5.0 | Take-profit distance as a multiple of the stop distance (reward-to-risk). |
MinDipAtrFrac |
0.10 | 0.0 | 1.5 | Minimum dip/poke depth beyond the mean, expressed as a fraction of ATR (a noise filter). |
Lots |
0.10 | 0.01 | 1.0 | Base lot size before equity scaling is applied. |
Deliberately, there are only a handful of tunable knobs. Each is an economically meaningful setting with a wide, coarse range rather than a micro-tuned "magic number," which helps reduce the risk of overfitting to a single dataset.
Recommended Chart Settings
This strategy was designed with trending FX majors and metals in mind — for example EUR/USD or XAU/USD (gold) — on intermediate timeframes such as M30 through H4. Those conditions tend to produce the sustained directional moves and orderly pullbacks that the logic is built to exploit.
That said, the code is written for a single, configurable timeframe and never hardcodes a symbol, so you can attach it to whatever chart your testing selects. Results will vary considerably across different instruments, timeframes, and market regimes. Always study the behavior on your specific symbol and timeframe using historical data before drawing any conclusions.
How to Install on MetaTrader 5
- Download the
.ex5file from the link below. - Copy it to your MT5
MQL5\Expertsfolder. - Restart MetaTrader 5 or refresh the Navigator panel.
- Drag the EA onto a chart matching the recommended symbol and timeframe.
- Configure the input parameters and enable Algo Trading.
What to Consider Before Using This EA
The strengths of this approach are worth understanding. Pullback entries within a confirmed trend historically tend to offer tighter stops than breakout chasing, because you enter near a point of temporary weakness rather than at a stretched extreme. The volatility-scaled stop adapts to changing conditions, the fixed reward-to-risk target enforces discipline, and the small parameter count keeps the logic transparent and less prone to curve-fitting.
There are real limitations, too. Elder-Ray and EMA-slope filters are lagging by nature: the trend gate confirms direction only after the EMA has already turned, so the strategy can be late to a fresh move and slow to recognize when a trend has ended. In ranging or choppy markets, the slope filter may flip back and forth, generating pullback signals that fail as price oscillates sideways — this is where trend-continuation systems typically struggle most. Sharp reversals can also turn what looked like a routine dip into the start of a new trend, stopping the trade out. Finally, because only one position is held at a time and exits are left entirely to the stop and target, the system will sit through adverse excursions without intervening. None of these traits make the strategy good or bad — they simply define the conditions under which it may or may not perform, and studying those conditions is the point.
Risk Management Tips
Sound risk management matters far more than any single entry rule. As you study this strategy, keep these general principles in mind:
- Risk a small, fixed fraction per trade. Many educational sources suggest never risking more than 1–2% of account equity on any single position. Size your lots so that a full stop-out stays within that limit.
- Start on a demo account. Test the strategy in a simulated environment first so you can observe its behavior across different market conditions without financial exposure.
- Understand drawdown. Every strategy experiences losing streaks. Know how large a peak-to-trough decline you are willing to tolerate before you commit real capital, and confirm the strategy's historical drawdown fits your comfort level.
- Account for costs. Spreads, commissions, and slippage all erode results and are easy to underestimate in testing.
- Never over-leverage. Leverage magnifies losses as readily as gains; keep exposure conservative.
Treat this EA as a framework for learning about trend-pullback logic and disciplined risk control — not as a substitute for your own research and judgment.
Risk Warning
Trading foreign exchange, CFDs, and other leveraged financial instruments involves substantial risk of loss and is not suitable for all investors. The strategies and tools discussed on this page are provided for educational purposes only and do not constitute financial advice, investment recommendations, or solicitation to trade. Always consult a qualified financial adviser before making trading decisions. Past backtest performance is not indicative of future results.
Downloads
- Expert Advisor: ElderRayTrendPullback.ex5 (44 downloads)
- Source Code: ElderRayTrendPullback.mq5 (46 downloads)
- Documentation: ElderRayTrendPullback.pdf (46 downloads)