
Disclaimer: This article is for educational and informational purposes only. It does not constitute financial or investment advice. Trading forex and CFDs carries significant risk of loss. Past performance of any strategy — including backtests — does not guarantee future results. Never trade with money you cannot afford to lose.
What Is This Strategy?
The Drift Significance Trend strategy is a trend-following Expert Advisor (EA) built around a classic statistics tool: the one-sample t-test. Instead of reacting to every up-tick or down-tick like a simple momentum system, it asks a sharper question — is the recent drift in price large enough that it is unlikely to be pure chance? Only when the answer is "yes" does the strategy consider a trade. This makes it a study in statistical significance filtering applied to price action.
Most beginner momentum systems fire on any positive or negative move, which means a large share of their signals are indistinguishable from the random noise of a coin-flip market. Drift Significance Trend tries to separate genuine directional pressure ("drift") from that noise by measuring a t-statistic on recent bar returns. A t-statistic is essentially a signal-to-noise ratio: it compares the average return to how spread out those returns are. A high absolute value historically suggests the move is unusually strong relative to its own volatility.
As a learning tool, this EA is well suited to intermediate traders and students of quantitative trading who want to see how a textbook statistical test can be translated into concrete entry rules. It is designed for trending market conditions and uses a longer-term Exponential Moving Average (EMA) as a regime filter so that short-term significance must agree with the prevailing direction. It is not a "set and forget" money machine — it is a transparent, parameter-light framework for understanding how significance testing can shape trade decisions.
How It Works
The strategy processes one completed candle at a time on the chart's timeframe. Here is how it forms and acts on a signal:
- Building the return sample: Over a rolling window of
Lookbackcompleted bars, the strategy computes the log returns of price — the natural logarithm of each bar's close divided by the previous close. Log returns are a standard way to measure percentage change that adds up cleanly over time. - Measuring significance: It then calculates the t-statistic of that sample:
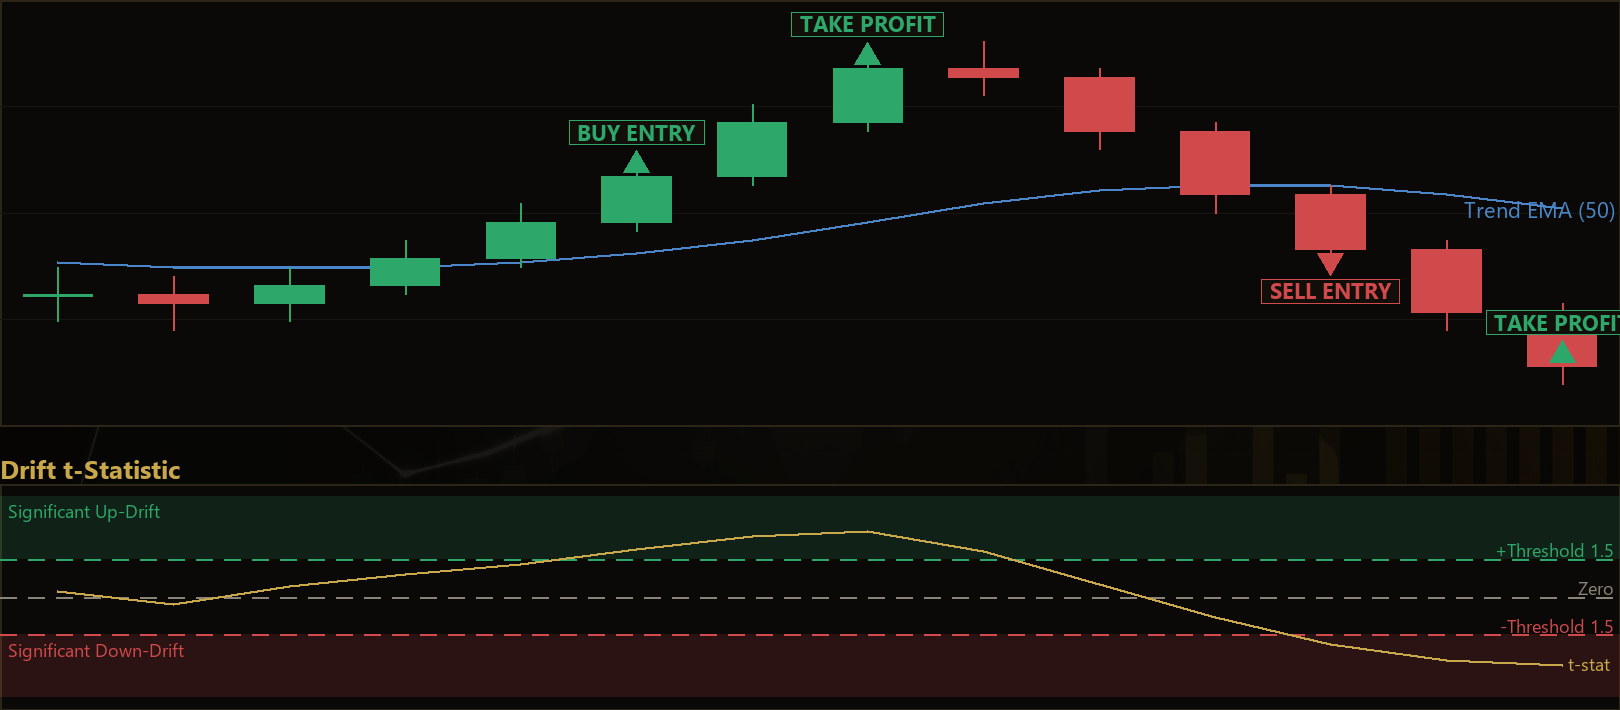
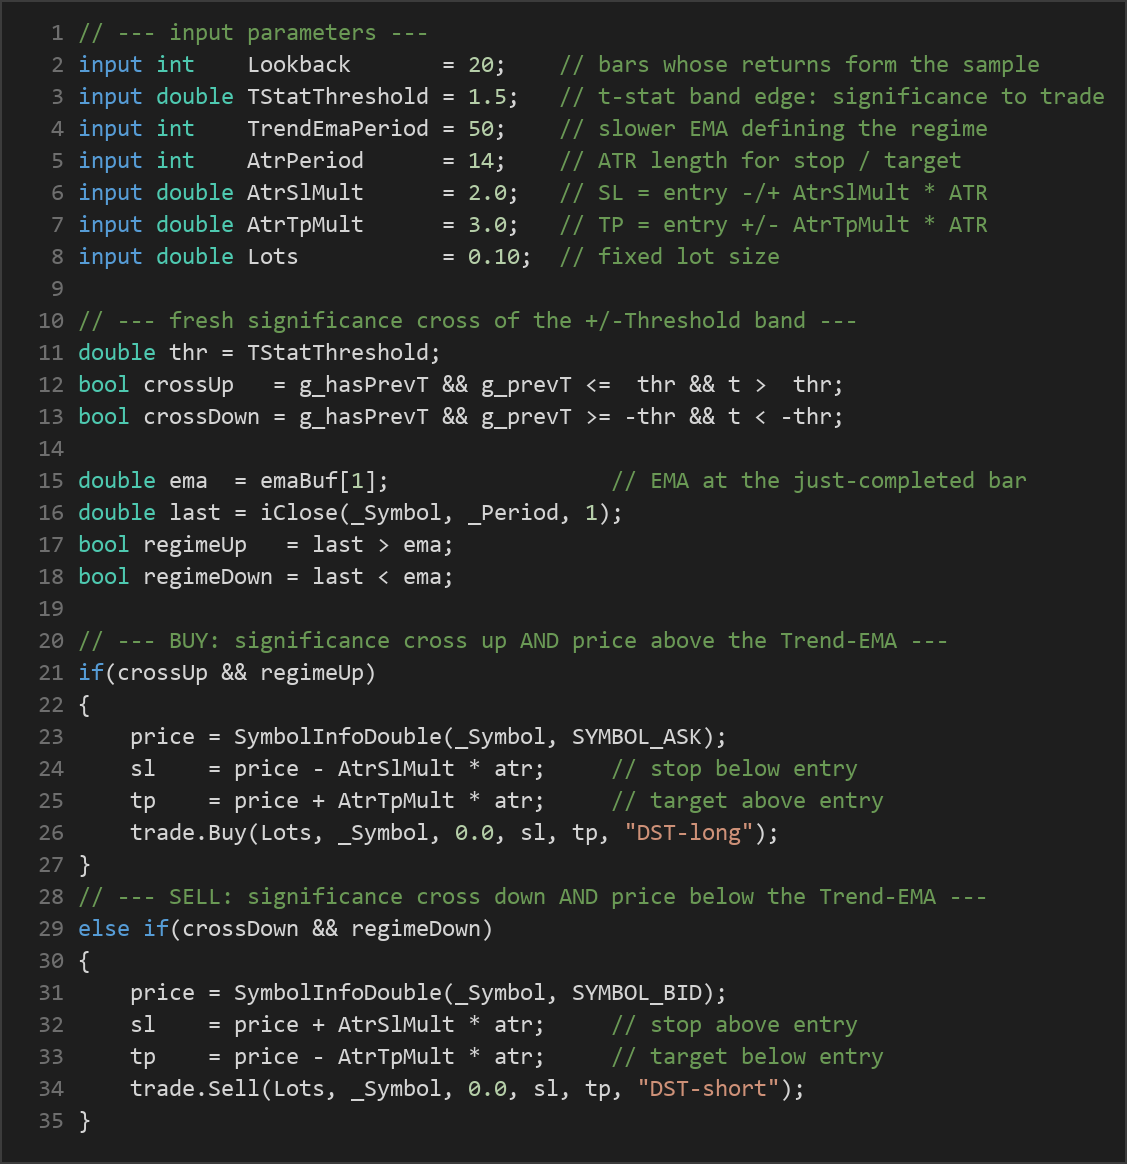
t = mean(returns) / (standard deviation / √N). A large positivetmeans the average drift is strongly upward relative to noise; a large negativetmeans strongly downward. A smalltmeans the moves are effectively random, so the strategy stands aside. - Entry on a fresh significance cross: The strategy signals a trade only when the t-statistic freshly crosses the significance band. If
twas inside the ±TStatThresholdband on the prior bar and pushes beyond it now, that is treated as the moment drift becomes significant. A cross above +threshold is a long candidate; a cross below −threshold is a short candidate. This "fresh cross" rule avoids re-entering every bar the reading stays high. - Regime filter (anti-whipsaw): Before acting, the signal must agree with a slower Trend-EMA. A long is only taken when the close is above the Trend-EMA, and a short only when the close is below it. This alignment reduces the chance of taking a significant short-term move that fights the larger trend.
- Stop-loss logic: Risk is controlled with the Average True Range (ATR), a volatility gauge. The stop-loss is placed
AtrSlMult × ATRaway from entry — below entry for longs, above for shorts — so the stop distance widens in volatile markets and tightens in calm ones. - Take-profit logic: The profit target is set
AtrTpMult × ATRfrom entry in the trade's favor. With the defaults, the target is wider than the stop, giving a reward-to-risk structure greater than 1:1 on each trade. - Position control: The strategy holds only one position per magic number at a time and uses a fixed lot size, keeping exposure simple and predictable.
The strategy signals an entry only when all of these conditions line up: a fresh t-statistic cross, agreement with the EMA regime, and a valid ATR reading. If any piece is missing, it waits.
Strategy Parameters
| Parameter | Default | Min | Max | Description |
|---|---|---|---|---|
| Lookback | 20 | 10 | 60 | Number of completed bars whose log returns form the significance sample. Shorter reacts faster; longer is smoother. |
| TStatThreshold | 1.5 | 0.5 | 3.0 | The t-statistic band edge. How significant the drift must be before a trade is considered. Higher = stricter, fewer signals. |
| TrendEmaPeriod | 50 | 20 | 200 | Period of the slower Trend-EMA that defines the regime the signal must agree with. |
| AtrPeriod | 14 | 7 | 30 | Length of the ATR used to measure volatility for stop and target distances. |
| AtrSlMult | 2.0 | 1.0 | 4.0 | Stop-loss multiplier. Stop = entry −/+ AtrSlMult × ATR. |
| AtrTpMult | 3.0 | 1.0 | 6.0 | Take-profit multiplier. Target = entry +/− AtrTpMult × ATR. |
| Lots | 0.10 | 0.01 | 1.0 | Fixed lot size used for each position. |
The parameter set is deliberately small and broadly ranged. Few, wide-ranging inputs make a strategy easier to reason about and help resist curve-fitting — the trap of tuning settings so tightly to past data that they fail on new data.
Recommended Chart Settings
Drift Significance Trend is a single-timeframe strategy: every calculation uses the chart's own timeframe, so it runs on whatever timeframe you attach it to. A common educational starting point is a major forex pair such as EUR/USD on the H1 (1-hour) timeframe, where trends develop cleanly and spreads are typically low. The default Lookback of 20 and TrendEmaPeriod of 50 are sensible on this timeframe.
You are encouraged to experiment on higher timeframes (H4, D1) for slower, higher-conviction signals, or explore other liquid instruments. Keep in mind that results will vary considerably across symbols, timeframes, and market regimes. What behaves well in a trending period may behave very differently in a choppy, range-bound one. Always test any configuration thoroughly on historical data and a demo account before drawing conclusions.
How to Install on MetaTrader 5
- Download the
DriftSignificanceTrend.ex5file from the link below. - Copy it to your MT5
MQL5\Expertsfolder. - Restart MetaTrader 5 or refresh the Navigator panel.
- Drag the EA onto a chart matching the recommended symbol and timeframe.
- Configure the input parameters and enable Algo Trading.
What to Consider Before Using This EA
Strengths of the approach. The core idea is intellectually honest: by requiring statistical significance before acting, the strategy is designed to skip much of the noise that traps naive momentum systems. The ATR-based stops and targets adapt to volatility automatically, and the EMA regime filter helps keep trades aligned with the broader trend. Because it uses only seven parameters, it is relatively transparent and easier to study than a heavily optimized black box.
Known limitations. A t-test assumes returns are reasonably well-behaved, but real market returns have fat tails, volatility clustering, and autocorrelation — so the "significance" it measures is an approximation, not a guarantee of a real trend. Like all trend-following logic, it can suffer in sideways, choppy markets, where t-statistic crosses may trigger entries just before price reverses (whipsaws). The fresh-cross rule and EMA filter reduce this but cannot eliminate it. News-driven spikes, low-liquidity sessions, and sudden regime changes can all produce signals that historically would not have held up.
Where it may underperform. Expect weaker behavior during range-bound consolidation, during major economic releases, and on instruments or timeframes with wide spreads relative to the ATR-based targets. This EA is best understood as an educational framework for exploring significance filtering, not as a finished, ready-to-fund system.
Risk Management Tips
- Position sizing: Keep lot sizes proportionate to your account. As a common educational guideline, structure your stop so that no single trade risks more than 1–2% of your account balance.
- Use a demo account first: Run the EA on a demo account across different market conditions before ever considering live capital. This lets you observe how it behaves without financial exposure.
- Understand drawdown: Every strategy experiences losing streaks. Study the maximum drawdown in your testing and ask whether you could tolerate it emotionally and financially.
- Diversify and stay realistic: Avoid concentrating everything into one strategy or one instrument. Treat automated systems as one part of a broader, disciplined approach.
- Monitor, don't abandon: Automated does not mean unattended. Check that the EA is behaving as expected and that market conditions still suit its trend-following design.
Risk Warning
Trading foreign exchange, CFDs, and other leveraged financial instruments involves substantial risk of loss and is not suitable for all investors. The strategies and tools discussed on this page are provided for educational purposes only and do not constitute financial advice, investment recommendations, or solicitation to trade. Always consult a qualified financial adviser before making trading decisions. Past backtest performance is not indicative of future results.
Downloads
- Expert Advisor: DriftSignificanceTrend.ex5 (36 downloads)
- Source Code: DriftSignificanceTrend.mq5 (36 downloads)
- Documentation: DriftSignificanceTrend.pdf (41 downloads)