Disclaimer: This article is for educational and informational purposes only. It does not constitute financial or investment advice. Trading forex and CFDs carries significant risk of loss. Past performance of any strategy — including backtests — does not guarantee future results. Never trade with money you cannot afford to lose.
What Is This Strategy?
The Drift Contrast Regime Shift strategy is a trend-following expert advisor built around a two-sample Welch t-test — a statistical tool that measures whether the average drift of price has changed between two adjacent windows of time. In trading terms, "drift" simply means the average per-bar return: is price leaning up, leaning down, or going nowhere? Rather than asking the usual momentum question of "is there a trend right now?", this strategy asks a sharper one: "has the drift just changed?"
That distinction matters. Most momentum systems answer "is drift present?" with a one-sample test, and a strong, already-established trend answers "yes" on every single bar. As a result those systems tend to enter late and give back a lot of profit near the end of a move. Drift Contrast Regime Shift instead contrasts two back-to-back windows of log returns — a recent window and the prior window immediately before it — and fires only when the recent drift has separated significantly from the older drift. This targets the transition, the moment a fresh trend ignites out of chop or reverses out of an old move.
As a learning tool, this strategy is well suited to intermediate traders who want to understand how classical statistics (hypothesis testing, variance, standard error) can be repurposed into a systematic entry filter. It is a study in regime detection — identifying the transition between market states — rather than a plug-and-play income tool. Treat it as a framework for exploring how statistical significance can be translated into disciplined, rules-based trade signals.
How It Works
At its core, the strategy computes a Welch t-statistic each time a bar closes. The recent window (R1) is the last Window log returns; the prior window (R2) is the Window returns immediately before that. The t-statistic is:
t = ( mean(R1) − mean(R2) ) / sqrt( var(R1)/Window + var(R2)/Window )
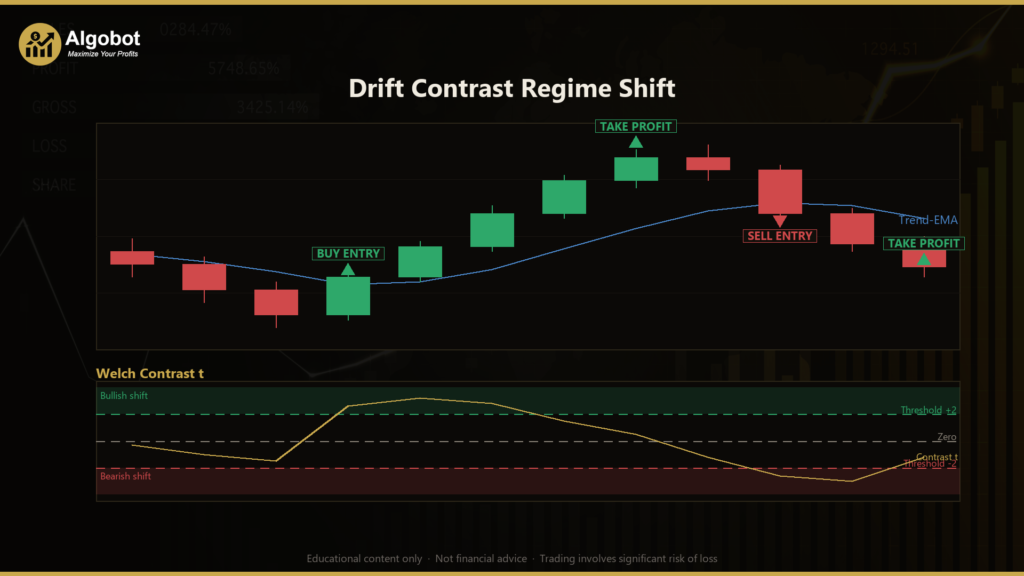
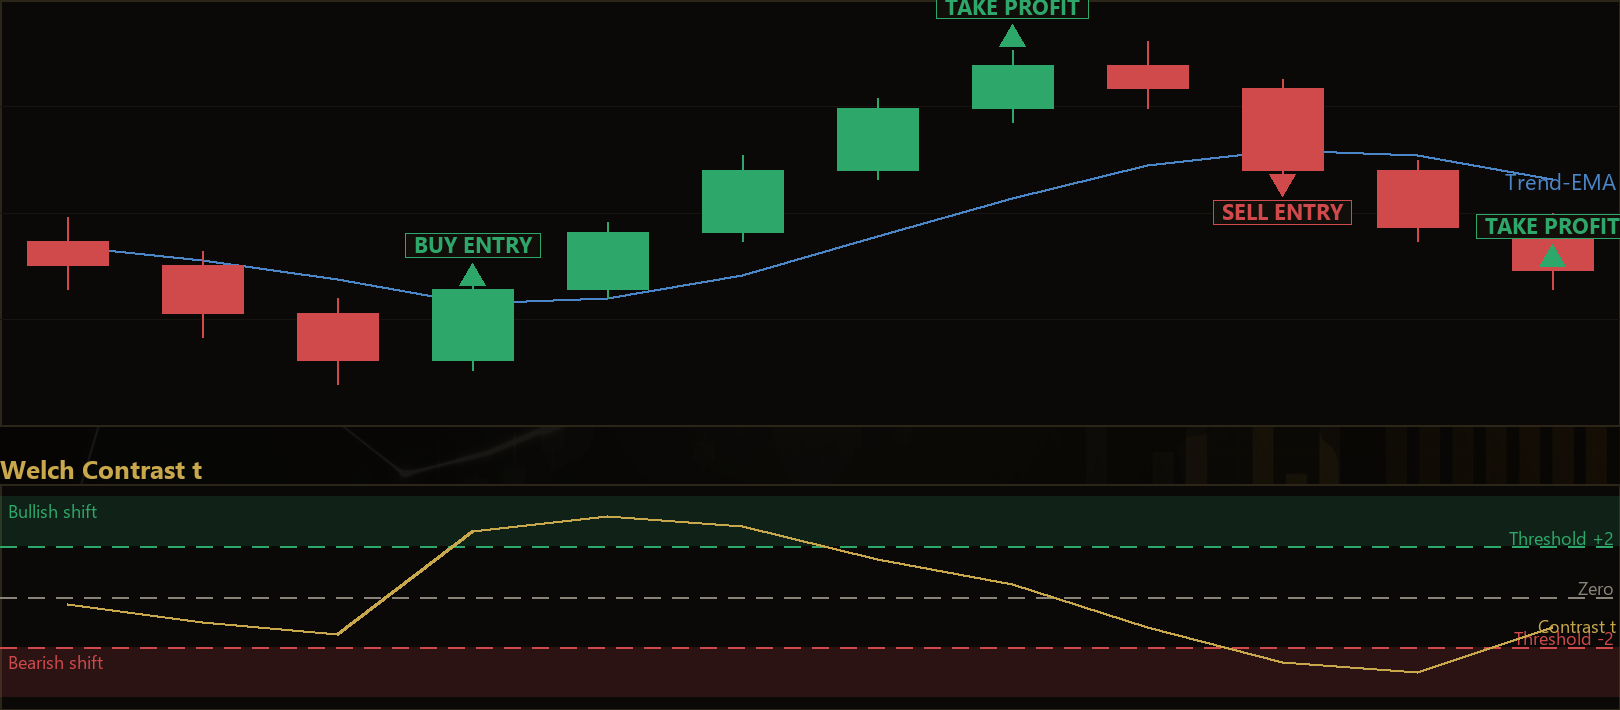
A large positive t means recent drift is significantly more bullish than before (a bullish regime shift); a large negative t means recent drift is significantly more bearish (a bearish regime shift); a t near zero means the two windows drift alike — either a steady trend or flat noise — so there is no new information and the strategy stands aside.
Here is how the strategy signals a trade:
- Long entry: the strategy signals a long when
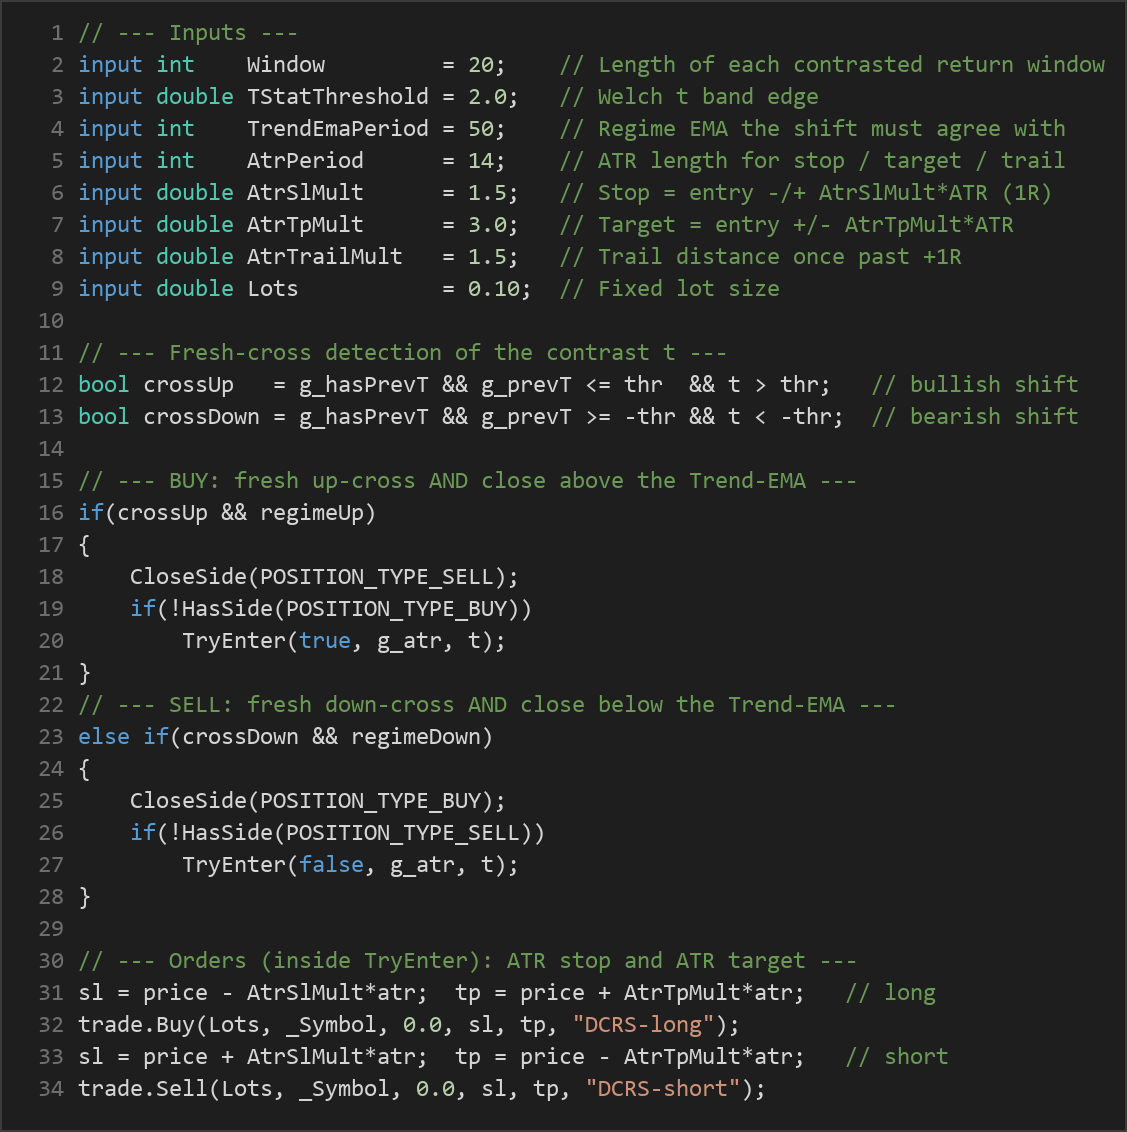
tmakes a fresh cross above+TStatThresholdand the closing price sits above the slower Trend-EMA (exponential moving average). The regime shift must agree with the prevailing trend direction. - Short entry: the strategy signals a short when
tmakes a fresh cross below−TStatThresholdand the closing price sits below the Trend-EMA. - "Fresh" cross: the signal fires only on the bar where
tfirst breaks the threshold — not on every bar it remains beyond it. This is what keeps entries focused on the ignition point. - Stop-and-reverse: an opposite fresh cross closes the current trade and opens a position on the other side, so the system is always aligned with the newest detected regime.
Exit logic has two layers:
- Dissipation exit: if the contrast
tdecays back through zero against the open position (for example,tturns negative while you hold a long), the statistical edge has evaporated and the trade is closed early. - ATR-based stop and target: every trade is opened with a stop-loss placed at
AtrSlMult × ATRfrom entry and a take-profit atAtrTpMult × ATR. ATR (Average True Range) is a volatility measure, so both distances automatically scale with current market conditions.
Drawdown control is a deliberate design goal — the intent is a shallow equity curve:
- The initial stop distance (
AtrSlMult × ATR) also defines "1R", the strategy's base unit of risk. - Once a trade reaches +1R of open profit, its stop is moved to break-even and then trailed by
AtrTrailMult × ATRon every tick. This locks in profit tick-by-tick and caps most adverse excursions near scratch. - Only one position per magic number is held at a time, sizing is a fixed lot, and the parameter set is intentionally small and broadly ranged to resist curve-fitting.
Strategy Parameters
| Parameter | Default | Min | Max | Description |
|---|---|---|---|---|
| Window | 20 | 8 | 50 | Length of each of the two adjacent return windows being contrasted. Larger values smooth the signal and react more slowly. |
| TStatThreshold | 2.0 | 0.5 | 4.0 | Welch t band edge — how decisively drift must have shifted before a trade is allowed. Higher values demand stronger statistical evidence. |
| TrendEmaPeriod | 50 | 20 | 200 | Period of the slower EMA that defines the regime the detected shift must agree with. |
| AtrPeriod | 14 | 7 | 30 | ATR length used for stop-loss, take-profit, and trailing distances. |
| AtrSlMult | 1.5 | 0.5 | 4.0 | Stop-loss distance as a multiple of ATR (also defines 1R). |
| AtrTpMult | 3.0 | 1.0 | 6.0 | Take-profit distance as a multiple of ATR. |
| AtrTrailMult | 1.5 | 0.5 | 4.0 | Trailing-stop distance (in ATR) applied once a trade is past +1R. |
| Lots | 0.10 | 0.01 | 1.0 | Fixed lot size used for every position. |
Recommended Chart Settings
The strategy is written to run on a single timeframe — every calculation uses the chart's primary timeframe, so it adapts to whatever period you attach it to. A common starting point for a statistical drift filter like this is a major FX pair such as EUR/USD on the H1 (1-hour) timeframe, where log-return windows of 20 bars represent a meaningful but responsive lookback. Because the Trend-EMA default of 50 and the twin 20-bar windows assume a reasonable volume of clean bars, liquid instruments and standard timeframes tend to behave more predictably than thin or exotic markets.
Remember that results will vary considerably across different symbols, timeframes, and market conditions. Always test any configuration on historical data and a demo account before considering live use.
How to Install on MetaTrader 5
- Download the .ex5 file from the link below
- Copy it to your MT5
MQL5\Expertsfolder - Restart MetaTrader 5 or refresh the Navigator panel
- Drag the EA onto a chart matching the recommended symbol and timeframe
- Configure the input parameters and enable Algo Trading
What to Consider Before Using This EA
Strengths. The design has a clear, testable thesis: trade the transition between drift regimes rather than the middle of an established move. Focusing on fresh threshold crosses, requiring agreement with a slower trend EMA, and closing on statistical dissipation are all mechanisms aimed at avoiding late, low-quality entries. The ATR-based stop, break-even move, and tick-by-tick trail reflect a genuine emphasis on capping drawdown, and the small, broadly ranged parameter set reduces the temptation to over-optimize.
Known limitations. Any statistical regime detector is vulnerable to whipsaws. In choppy, directionless markets the contrast t can flip across the threshold repeatedly, triggering stop-and-reverse trades that each cost spread and commission. The Welch t-test also assumes returns are roughly well-behaved; during news spikes, gaps, or illiquid sessions those assumptions break down and signals can misfire. Because the strategy trades transitions, it may sit out long, smooth trends where the drift never "changes" enough to fire — precisely the moves some trend followers live for.
Where it may underperform. Expect the most friction in range-bound, low-volatility conditions and around scheduled high-impact news. Very fast timeframes may generate signals dominated by microstructure noise rather than genuine drift shifts. As with any single-instrument, fixed-lot system, performance can differ sharply between one symbol and another. None of these observations imply a favorable or unfavorable outcome — they are simply the conditions a student of this method should watch and test for.
Risk Management Tips
Sound risk management matters more than any single entry rule. Consider these general principles:
- Risk a small, fixed fraction per trade. Many educators suggest risking no more than 1–2% of account equity on any single position. Size your lots so that the ATR-based stop distance corresponds to that fraction, rather than leaving
Lotsat a default that may be too large for your account. - Understand drawdown. Even a system designed for a shallow equity curve will endure losing streaks. Know the maximum peak-to-trough decline you are willing to tolerate before you begin.
- Start on a demo account. Run the EA in MT5's Strategy Tester and on a demo account across varied market conditions before committing real capital. This is how you learn the strategy's behavior without financial consequence.
- Account for costs. Spread, commission, and slippage erode results, especially in a stop-and-reverse system that can trade actively. Include realistic costs in every backtest.
- Never rely on a single strategy or optimization. Diversify your study, and re-validate parameters on out-of-sample data to guard against curve-fitting.
Risk Warning
Trading foreign exchange, CFDs, and other leveraged financial instruments involves substantial risk of loss and is not suitable for all investors. The strategies and tools discussed on this page are provided for educational purposes only and do not constitute financial advice, investment recommendations, or solicitation to trade. Always consult a qualified financial adviser before making trading decisions. Past backtest performance is not indicative of future results.
Downloads
- Expert Advisor: DriftContrastRegimeShift.ex5 (41 downloads)
- Source Code: DriftContrastRegimeShift.mq5 (43 downloads)
- Documentation: DriftContrastRegimeShift.pdf (51 downloads)