Disclaimer: This article is for educational and informational purposes only. It does not constitute financial or investment advice. Trading forex and CFDs carries significant risk of loss. Past performance of any strategy — including backtests — does not guarantee future results. Never trade with money you cannot afford to lose.
What Is This Strategy?
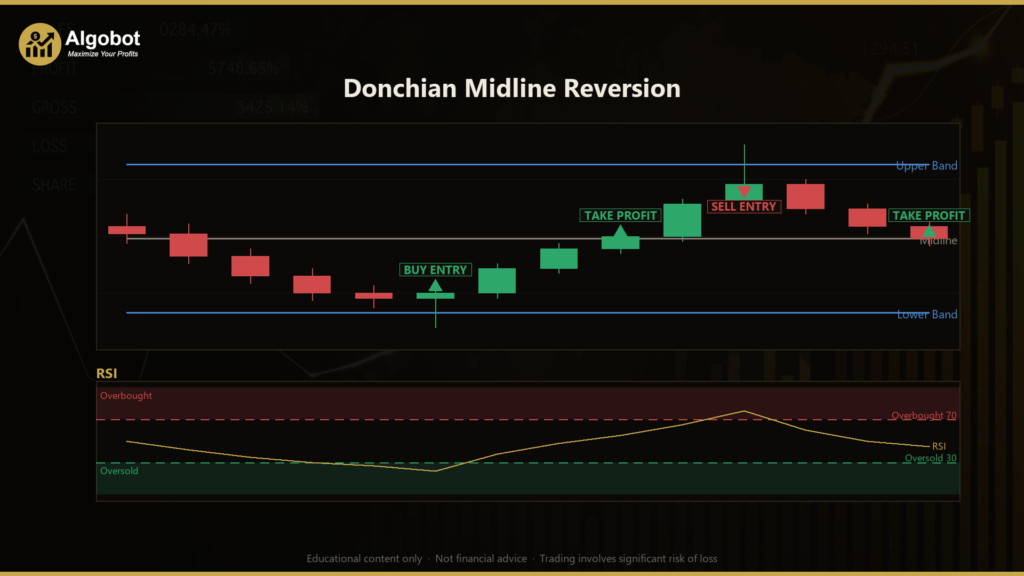
The Donchian Midline Reversion strategy is a range-based mean-reversion system that combines the Donchian Channel with the Relative Strength Index (RSI) to fade failed breakouts. Mean reversion is a trading style built on the idea that when price stretches to an extreme, it often snaps back toward an average or "fair" value rather than continuing in the same direction. The Donchian Channel — a band drawn from the highest high and lowest low over a set number of bars — defines the boundaries of the recent range, and the midpoint of that channel becomes the reversion target the strategy aims for.
Rather than chasing momentum, this expert advisor (EA) waits for a false break: a bar that pierces the outer edge of the channel but then closes back inside it. That rejection, paired with an RSI reading at an extreme, is treated as evidence that the breakout has failed and that price may rotate back toward the middle of the range. To avoid trading in dead, compressed conditions where mean reversion tends to whipsaw, the strategy also applies a minimum channel-width filter measured in Average True Range (ATR) units — ATR being a common gauge of recent volatility.
As a learning tool, the Donchian Midline Reversion is well suited to traders who want to study how range-trading logic, oscillator confirmation, and volatility filters combine into a single rules-based system. It is a strategy analysis, not a shortcut — the value here is in understanding why each condition exists and how they interact, so you can evaluate whether this style of approach fits your own testing and research.
How It Works
The strategy evaluates conditions once per completed bar and holds only one position at a time. Long and short logic are fully symmetric — mirror images of each other. Here is how the strategy signals a trade:
Building the range:
- The Donchian Channel is calculated from the
ChannelPeriodbars before the signal bar, so the signal bar's own pierce does not distort the band. This gives a stable upper band (highest high), lower band (lowest low), and midline (the average of the two). - ATR is measured to represent current volatility, and RSI is measured to gauge whether price is stretched.
The volatility filter:
- If the channel width (upper minus lower) is narrower than
MinWidthAtr× ATR, the strategy skips the bar entirely. This filters out flat, compressed ranges where reversion signals tend to whipsaw.
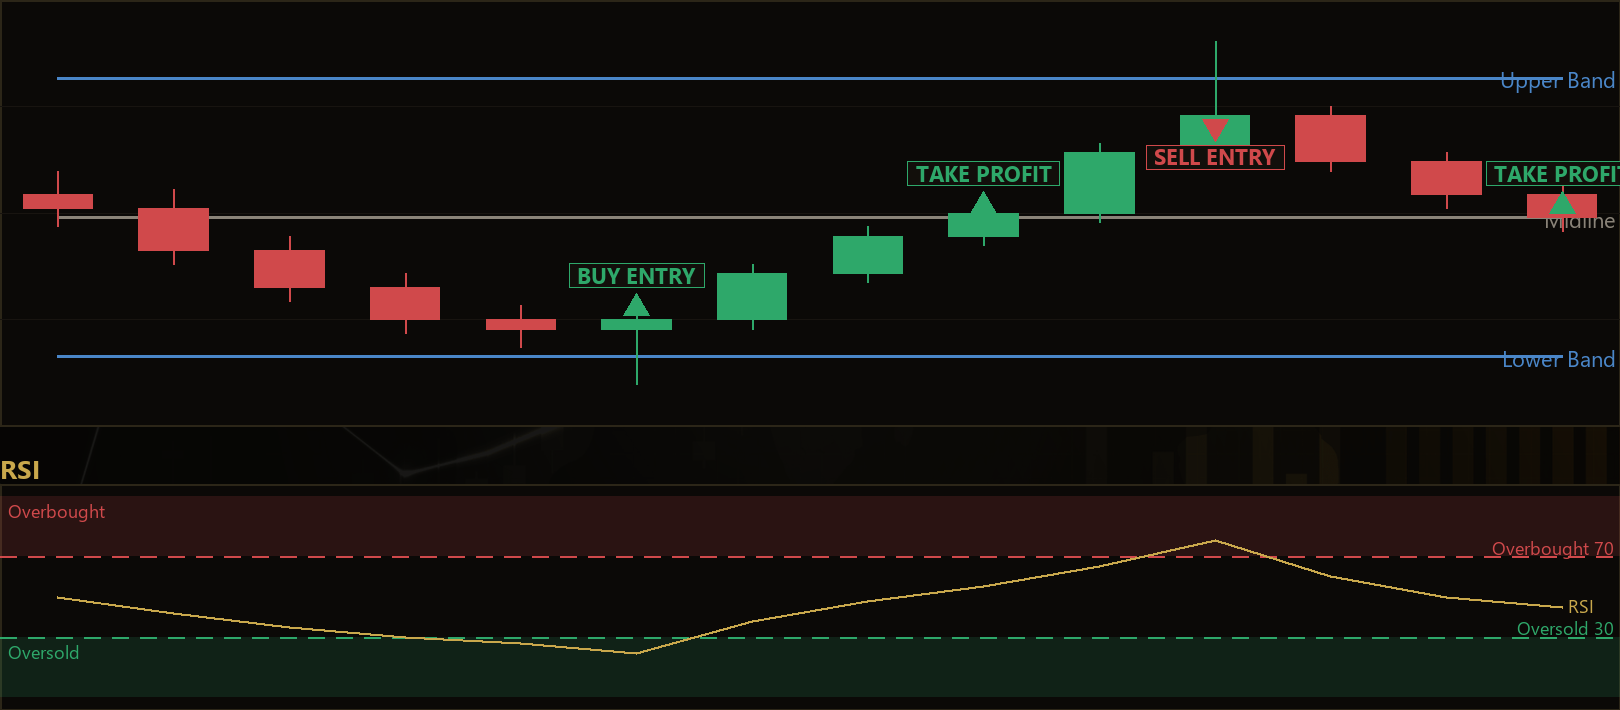
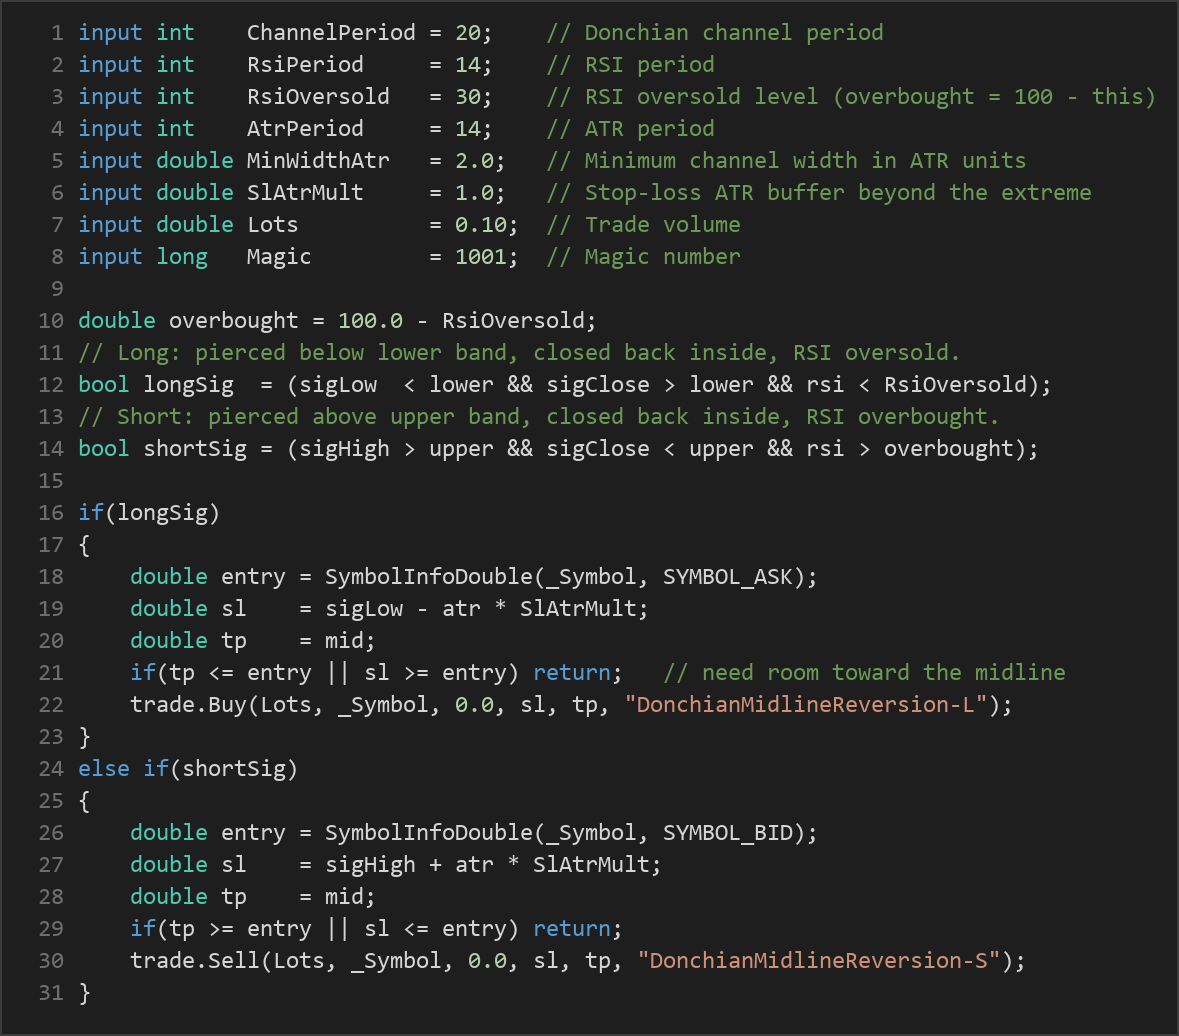
Long entry — the strategy signals a buy when:
- The signal bar's low pierces below the lower band (a downside false break), and
- The bar closes back inside the channel (above the lower band — the rejection), and
- RSI is below the
RsiOversoldlevel, indicating an oversold extreme.
Short entry — the strategy signals a sell when:
- The signal bar's high pierces above the upper band (an upside false break), and
- The bar closes back inside the channel (below the upper band), and
- RSI is above the overbought level, which is automatically calculated as 100 −
RsiOversold.
Stop-loss logic:
- For longs, the stop sits just below the rejected low, buffered by
SlAtrMult× ATR. - For shorts, the stop sits just above the rejected high, buffered by the same ATR multiple.
- Placing the stop beyond the failed extreme means the trade is invalidated only if price genuinely breaks through the level it just rejected.
Take-profit logic:
- The target is the channel midline for both directions — the reversion destination at the middle of the range.
- Before sending an order, the strategy checks that there is genuine room between entry and the midline, and that the stop sits on the correct side of the entry. If the geometry doesn't allow a valid trade, the signal is skipped.
Strategy Parameters
| Parameter | Default | Min | Max | Description |
|---|---|---|---|---|
| ChannelPeriod | 20 | 10 | 60 | Number of bars used to build the Donchian channel that defines the range and midline. |
| RsiPeriod | 14 | 7 | 28 | Lookback length for the RSI oscillator that confirms an extreme. |
| RsiOversold | 30 | 15 | 40 | RSI level marking oversold for longs; the overbought level is derived as 100 − this value. |
| AtrPeriod | 14 | 7 | 28 | Lookback length for the ATR used in the width filter and stop buffer. |
| MinWidthAtr | 2.0 | 1.0 | 5.0 | Minimum channel width, in ATR units, required before a trade is allowed. |
| SlAtrMult | 1.0 | 0.5 | 3.0 | ATR multiple added beyond the rejected extreme to place the stop-loss. |
| Lots | 0.10 | 0.01 | 1.0 | Fixed trade volume in lots. |
Recommended Chart Settings
This EA is designed as a general-purpose range mean-reversion tool and works on standard forex symbols. A common starting point for studying this style is a major currency pair such as EUR/USD on an intraday timeframe like the H1 (1-hour) chart, where ranges and false breaks are frequent enough to generate signals without excessive noise. The default parameters (a 20-bar channel, 14-period RSI and ATR) are tuned around this kind of setting.
Because mean-reversion behavior differs across instruments and sessions, results will vary considerably across different symbols, timeframes, and market conditions. Trending markets, in particular, can behave very differently from the ranging conditions this strategy targets. Always test any configuration on your own broker's data before drawing conclusions.
How to Install on MetaTrader 5
- Download the .ex5 file from the link below.
- Copy it to your MT5
MQL5\Expertsfolder. - Restart MetaTrader 5 or refresh the Navigator panel.
- Drag the EA onto a chart matching the recommended symbol and timeframe.
- Configure the input parameters and enable Algo Trading.
What to Consider Before Using This EA
Every strategy has strengths and trade-offs, and understanding both is part of learning to evaluate systems objectively.
Strengths of this approach:
- Defined structure. Entries, stops, and targets are all anchored to objective, chart-derived levels (channel bands and midline), which makes the logic transparent and repeatable.
- Confluence, not a single trigger. Requiring a false break and an RSI extreme and a minimum volatility width reduces the number of low-quality signals compared with a single-condition system.
- Symmetric design. Long and short logic are identical mirrors, so the strategy does not carry a directional bias.
Known limitations:
- Trend risk. Mean-reversion strategies fade moves, which means they can struggle badly during strong, sustained trends where the "false break" turns out to be a genuine breakout. The stop-loss beyond the rejected extreme is designed to cap that scenario, but repeated trending conditions may produce a string of losing trades.
- Fixed lot sizing. The
Lotsparameter is a static volume; it does not scale risk to account size or to the distance between entry and stop, so the monetary risk per trade can vary from signal to signal. - One position at a time. The EA holds a single position per magic number, so it may sit out additional opportunities while a trade is open.
- Parameter sensitivity. Channel period, RSI thresholds, and the width filter all interact. Values that historically suited one market may perform very differently on another.
This is a tool for study and structured testing — not a set-and-forget solution. Treat it as a framework to understand, question, and stress-test.
Risk Management Tips
Sound risk management matters more than any single entry rule. As you study this or any strategy, keep these general principles in mind:
- Risk a small, fixed fraction per trade. Many educational sources suggest never risking more than 1–2% of account equity on a single position. Because this EA uses a fixed lot size, you may need to adjust
Lotsso the distance to your stop stays within that comfort zone. - Start on a demo account. Test the strategy in a risk-free simulated environment first so you can observe how it behaves across different conditions before any real capital is involved.
- Understand drawdown. A losing streak is a normal statistical outcome for any system. Know how large a drawdown you can tolerate — both financially and emotionally — before you deploy anything live.
- Diversify and size sensibly. Avoid concentrating all exposure in a single symbol or a single strategy, and keep total risk across open positions within your plan.
- Keep records. Logging your tests and reviewing them honestly is one of the most valuable habits a developing trader can build.
Risk Warning
Trading foreign exchange, CFDs, and other leveraged financial instruments involves substantial risk of loss and is not suitable for all investors. The strategies and tools discussed on this page are provided for educational purposes only and do not constitute financial advice, investment recommendations, or solicitation to trade. Always consult a qualified financial adviser before making trading decisions. Past backtest performance is not indicative of future results.
Downloads
- Expert Advisor: DonchianMidlineReversion.ex5 (66 downloads)
- Source Code: DonchianMidlineReversion.mq5 (58 downloads)
- Documentation: DonchianMidlineReversion.pdf (65 downloads)