Disclaimer: This article is for educational and informational purposes only. It does not constitute financial or investment advice. Trading forex and CFDs carries significant risk of loss. Past performance of any strategy — including backtests — does not guarantee future results. Never trade with money you cannot afford to lose.
What Is This Strategy?
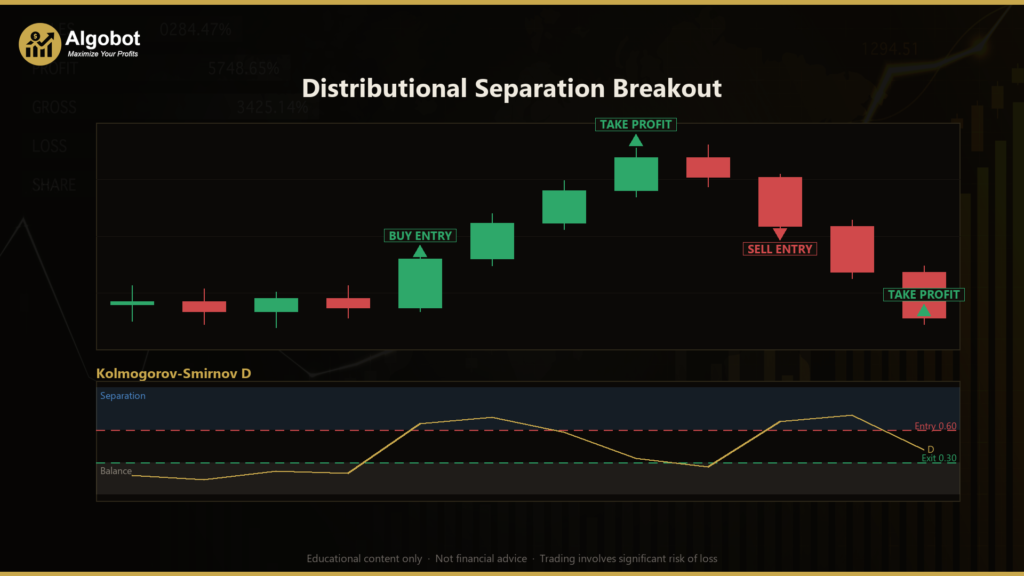
The Distributional Separation Breakout is a breakout strategy built on the two-sample Kolmogorov–Smirnov (KS) statistic, a classic tool from statistics that measures how far apart two data distributions are. Instead of firing on a single price extreme the way a traditional range breakout does, this strategy compares the whole shape of recent price behaviour against the price behaviour that came just before it. When the two no longer look like they came from the same distribution, the strategy treats that as a genuine regime change and signals a directional trade. It is a trend-ignition, breakout-style system rather than a scalping or mean-reversion approach.
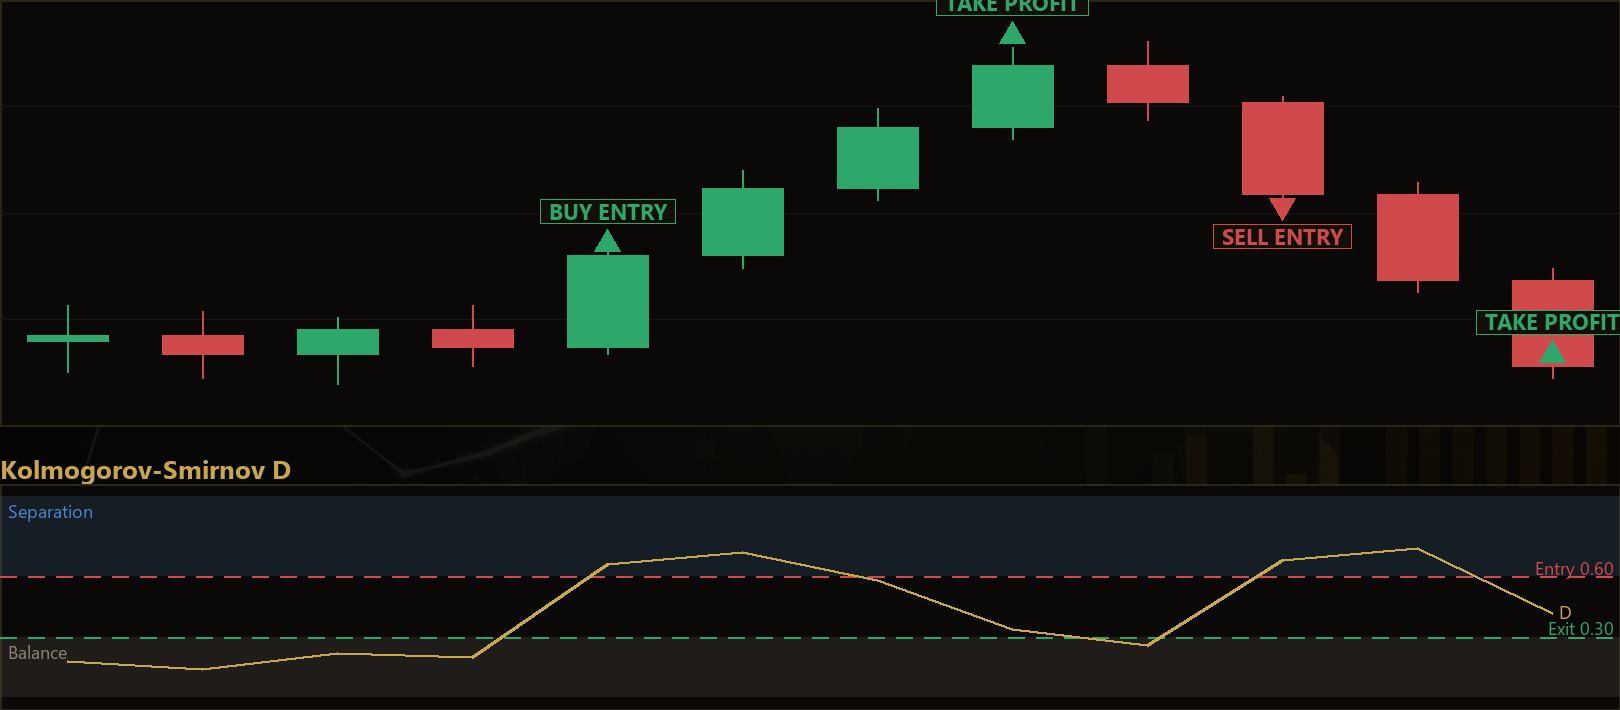
The core idea is intuitive once you see the mechanics. The strategy takes two adjacent windows of closing prices of equal length: a "recent" window (the most recent N closes) and a "prior" window (the N closes immediately before them). Each window has an empirical cumulative distribution function (CDF) — a simple description of where prices spent their time. The KS statistic, written as D, is the largest vertical gap between the two CDF curves and always sits between 0 and 1. When D is near 0 the two windows overlap almost perfectly, which means price is oscillating inside one balanced range. When D climbs toward 1 the recent prices have decoupled from the prior range, which the strategy interprets as a real distributional breakout.
As a learning tool this strategy is well suited to traders who want to understand statistical, distribution-aware ways of detecting regime change, as opposed to the more common price-level or moving-average methods. Because the KS statistic is scale-free, it needs no per-symbol tuning of its thresholds, which makes it a clean example for studying how a non-parametric test behaves across different markets. It is not a beginner "set and forget" product — it is best treated as an educational study of how distribution shift can be turned into a mechanical trading rule.
How It Works
The strategy evaluates its logic once per completed bar and builds every signal from the two price windows and the ATR (Average True Range, a standard volatility measure). Here is what happens step by step:
- Build the two windows. The strategy stores closing prices and, on each new bar, forms the recent window (last N closes) and the prior window (the N closes before those), where N is the
SampleWindowparameter. - Measure separation. It computes the KS statistic D — the maximum gap between the two windows' CDFs. A high D means the recent prices have relocated away from the prior range.
- Detect a fresh separation. A signal is only armed on a fresh cross: D must have been below
KsEntryon the previous bar and reach or exceedKsEntryon the current bar. This ensures the strategy reacts to the moment a new regime separates out of balance, not to a level that has already been elevated for a while. - Choose direction from the mean shift. Direction comes from the sign of the difference between the two windows' average prices. The strategy signals a long when the recent mean is above the prior mean by at least
DirAtrFrac× ATR, and a short when the recent mean is below the prior mean by the same margin. - Filter out volatility-only moves. Requiring the mean shift to clear a fraction of ATR is deliberate. A market can change its distribution simply by becoming more volatile (D high) without any net drift. That directionless case is filtered out so the strategy only trades when the bulk of trade has genuinely moved up or down.
- Reverse on opposite separation. If a position is open and a fresh separation prints in the opposite direction, the strategy closes the current trade and can flip to the new side.
- Dissipation exit. If D falls back below
KsExit, the two distributions have re-merged — the breakout has decayed back into a range — and the strategy closes the position. The exit threshold is always kept strictly below the entry threshold so a trade cannot open and instantly fail its own dissipation test. - Stop-loss. Every position is protected with a stop placed
SlAtrMult× ATR away from the entry price. - Take-profit. Every position also carries a target placed
TpAtrMult× ATR away from the entry price.
In plain English: the strategy waits until recent price action has statistically separated from the range that preceded it, confirms there is a real directional shift rather than just extra noise, enters in that direction, and then manages the trade with an ATR stop and target while watching for the distributions to merge back together.
Strategy Parameters
| Parameter | Default | Min | Max | Description |
|---|---|---|---|---|
| SampleWindow | 24 | 10 | 60 | Length N of each price window. Both the recent and prior windows use this many closes, so the strategy needs 2×N bars of history. |
| KsEntry | 0.60 | 0.30 | 0.95 | The KS statistic level D must freshly cross up through to arm a separation signal. Higher values demand a cleaner, more complete distribution shift. |
| KsExit | 0.30 | 0.00 | 0.70 | The level D must fall back below for the dissipation exit. Automatically clamped below KsEntry so exits stay consistent. |
| DirAtrFrac | 0.50 | 0.00 | 2.00 | Minimum mean shift between the windows, expressed as a fraction of ATR, required to give the trade a direction. Screens out volatility-only regime changes. |
| AtrPeriod | 14 | 7 | 30 | Lookback period for the ATR used in the direction filter, stop, and target. |
| SlAtrMult | 2.0 | 1.0 | 4.0 | Stop-loss distance from entry, measured in multiples of ATR. |
| TpAtrMult | 3.0 | 1.0 | 6.0 | Take-profit distance from entry, measured in multiples of ATR. |
| Lots | 0.10 | 0.01 | 1.0 | Fixed position size in lots for each trade. |

Recommended Chart Settings
The Distributional Separation Breakout is designed as a general-purpose, scale-free breakout study, so it does not depend on a single symbol. Because the KS statistic and ATR are both self-scaling, the same default thresholds can be applied across major forex pairs without per-symbol tuning. A common starting point for testing is a liquid major such as EUR/USD or GBP/USD on the H1 (1-hour) timeframe, which gives the 2×N-bar windows enough completed bars to form meaningful distributions while keeping signals frequent enough to study.
You can experiment with higher timeframes such as H4 or D1 for slower, more deliberate regime changes, or shorter windows for faster reaction. Keep in mind that results will vary significantly across symbols, timeframes, and market conditions. Always study the behaviour on your chosen instrument in a testing environment before drawing any conclusions.
How to Install on MetaTrader 5
- Download the .ex5 file from the link below
- Copy it to your MT5
MQL5\Expertsfolder - Restart MetaTrader 5 or refresh the Navigator panel
- Drag the EA onto a chart matching the recommended symbol and timeframe
- Configure the input parameters and enable Algo Trading
What to Consider Before Using This EA
Every strategy has strengths and limitations, and understanding both is part of using any tool responsibly.
Strengths. The distribution-comparison approach is genuinely different from single-tick range breakouts. By requiring the bulk of recent trade to relocate, it is more resistant to isolated spikes and wicks that would trigger a naive Donchian breakout. The KS statistic is non-parametric and scale-free, so it makes no assumption about prices being normally distributed and needs no per-symbol threshold tuning. The ATR-based direction filter is a thoughtful addition, since it separates a directional breakout from a pure volatility expansion — a distinction many breakout systems ignore.
Known limitations. Because the strategy waits for a full distributional separation to build, it is inherently a lagging confirmation tool: by the time D crosses the entry threshold, part of the move may already be complete. In choppy, sideways markets that never produce a clean separation, signals will be sparse, and the ones that do fire can be prone to false starts if the range re-forms quickly. The fixed Lots sizing does not scale with account equity or volatility, so position risk is not automatically normalised across instruments. And like all breakout logic, it can suffer whipsaws when a breakout immediately reverses, which the dissipation exit only partly mitigates.
Where it may underperform. Tight, low-volatility ranges and news-driven single-bar spikes are the classic difficult environments. The former rarely generates a qualifying separation; the latter can shift the distribution and mean sharply without any follow-through. Treat this EA as an educational study of statistical regime detection, not as a finished, hands-off system.
Risk Management Tips
Sound risk management matters far more than any single entry signal. Consider these general principles as you study this or any strategy:
- Risk a small, fixed percentage per trade. A widely taught guideline is to risk no more than 1–2% of your account on any single position. Because this EA uses a fixed lot size, you may need to adjust
LotsandSlAtrMultso the worst-case loss stays within that budget for your account. - Understand your drawdown tolerance. Study how deep and how long the strategy's losing streaks can run in testing, and ask yourself honestly whether you could keep following the rules through that period.
- Always start on a demo account. Run the strategy in a risk-free simulated environment first so you can observe its behaviour, signal frequency, and trade management without exposing real capital.
- Diversify and avoid over-leverage. Concentrating risk in one symbol or using excessive leverage can turn a normal drawdown into a serious loss. Size positions conservatively.
- Keep expectations realistic. No mechanical strategy works in every market regime. The goal of studying a system like this is to learn how distribution-based signals behave — not to expect a particular outcome.
Risk Warning
Trading foreign exchange, CFDs, and other leveraged financial instruments involves substantial risk of loss and is not suitable for all investors. The strategies and tools discussed on this page are provided for educational purposes only and do not constitute financial advice, investment recommendations, or solicitation to trade. Always consult a qualified financial adviser before making trading decisions. Past backtest performance is not indicative of future results.
Downloads
- Expert Advisor: DistributionalSeparationBreakout.ex5 (29 downloads)
- Source Code: DistributionalSeparationBreakout.mq5 (31 downloads)
- Documentation: DistributionalSeparationBreakout.pdf (38 downloads)