Disclaimer: This article is for educational and informational purposes only. It does not constitute financial or investment advice. Trading forex and CFDs carries significant risk of loss. Past performance of any strategy — including backtests — does not guarantee future results. Never trade with money you cannot afford to lose.
What Is This Strategy?
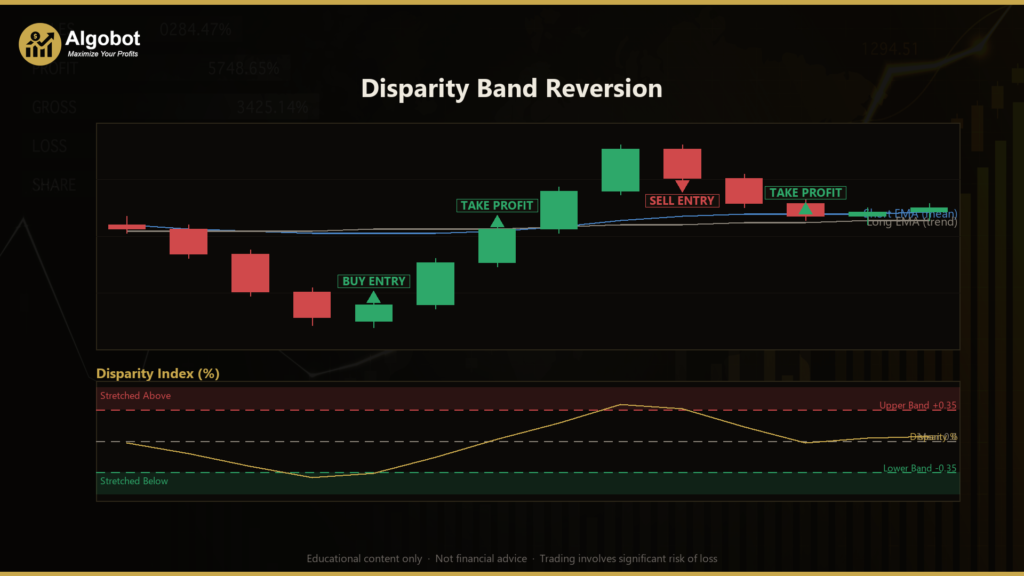
The Disparity Band Reversion strategy is a mean-reversion trading system built around the Disparity Index, a classic momentum-and-distance indicator that measures how far the current price has stretched away from its moving average. In plain terms, the Disparity Index answers one question: "How overextended is price right now?" It is expressed as a percentage — the gap between the closing price and a short Exponential Moving Average (EMA), a moving average that weights recent prices more heavily than older ones.
Mean-reversion strategies are designed for markets that tend to oscillate around a fair value rather than trend relentlessly in one direction. When price spikes too far above or below its short-term average, this approach assumes it will often "snap back" toward the mean. To avoid the most common failure of naive reversion — fighting a strong trend that keeps stretching further — the Disparity Band Reversion strategy adds a longer-EMA slope filter that classifies the market as up-trending, down-trending, or flat, and only takes trades that make sense for the current regime.
This strategy is best understood as a learning tool for traders who want to study how distance-from-the-mean signals behave, how a trend filter can reduce false reversion trades, and how volatility-based stops and targets are constructed. It is not a shortcut to results, and it is not suited to anyone hoping to skip the work of understanding market structure. Think of it as a transparent, rules-based framework you can dissect, test, and learn from.
How It Works
The strategy runs on a single timeframe and acts once per completed bar, meaning it only evaluates signals after a candle has fully closed. This keeps signals stable and objective rather than reacting to every price flicker. Here is the logic, step by step.
The core measurements:
- Disparity % is calculated as
(Close / short EMA − 1) × 100. A negative value means price closed below its short EMA (stretched down); a positive value means price closed above it (stretched up). - The regime filter measures the slope of a longer EMA over a set look-back window, then normalizes that slope into ATR units (Average True Range, a volatility measure). This makes the trend reading comparable across different instruments and market conditions.
- Candle confirmation requires the just-closed candle body to agree with the trade direction — a bullish candle (close above open) for buys, a bearish candle (close below open) for sells.
Entry conditions the strategy signals:
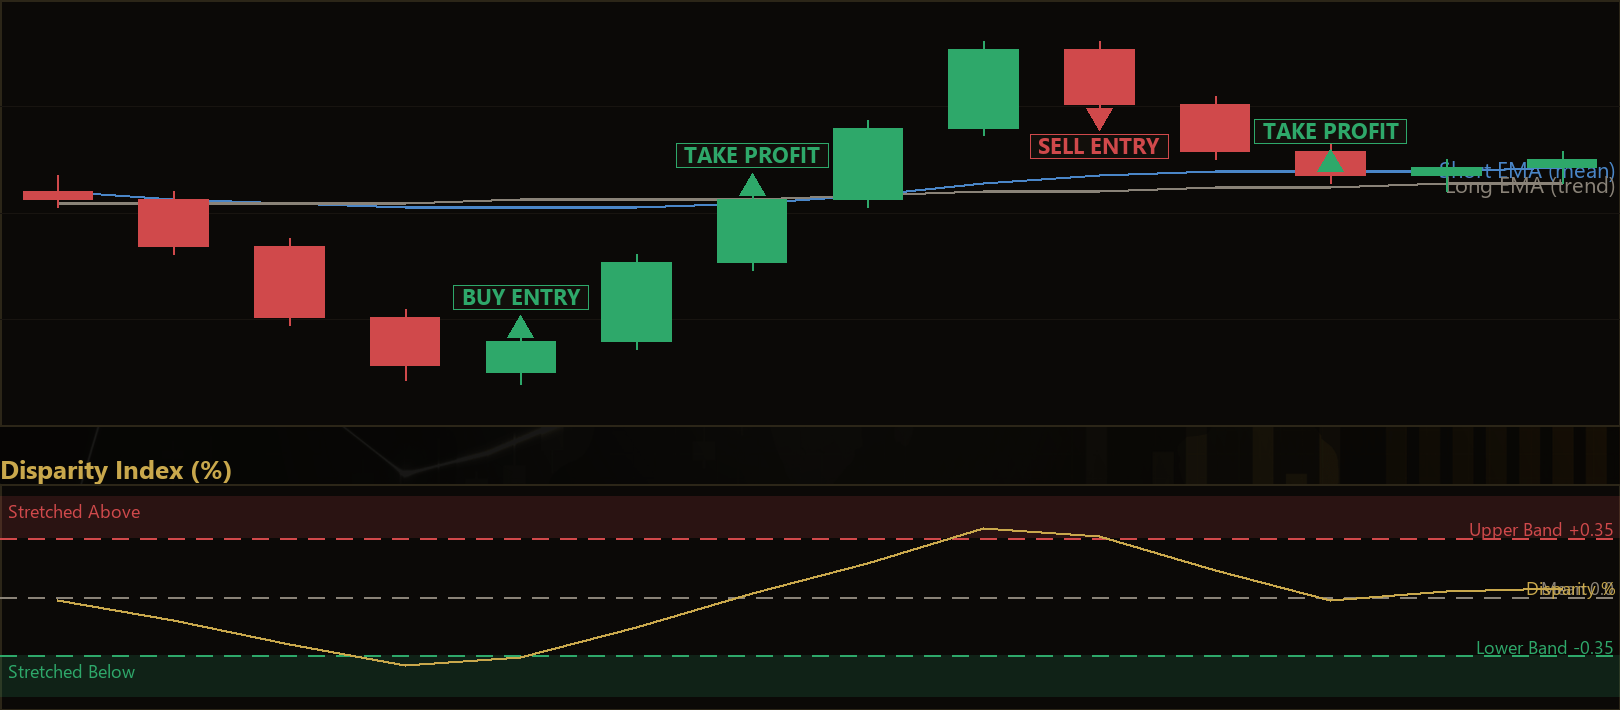
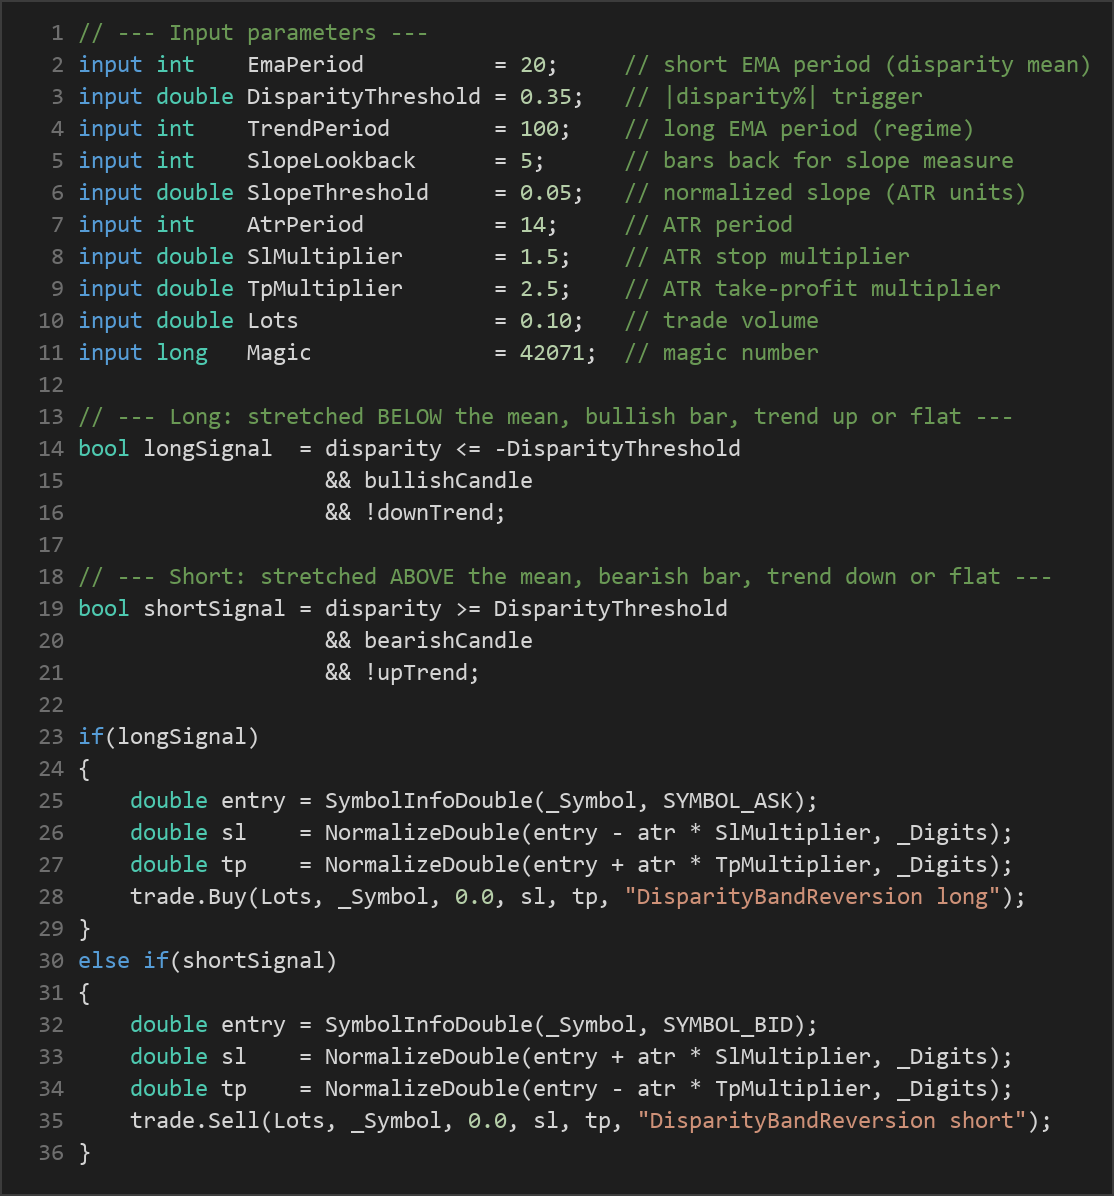
- Long (buy): Disparity has dropped to or below the negative threshold (price stretched below the mean), the closing candle is bullish, and the market is not in a confirmed downtrend. In an uptrend this becomes a with-trend pullback buy; in a flat market it is a pure reversion buy.
- Short (sell): Disparity has risen to or above the positive threshold (price stretched above the mean), the closing candle is bearish, and the market is not in a confirmed uptrend. In a downtrend this becomes a with-trend rally fade; in a flat market it is a pure reversion sell.
- In a flat regime, both extremes are faded. In a trending regime, only with-trend entries are allowed — the strategy will never buy dips inside a strong downtrend or fade rallies inside a strong uptrend.
Exit conditions:
- Mean reclaim: If an open buy sees price close back at or above the short EMA — or an open sell sees price close back at or below it — the position is closed. The idea being tested is that once price returns to its mean, the reversion has done its job.
- ATR stop-loss: Each trade places a protective stop a multiple of ATR away from entry, so the risk distance automatically adapts to current volatility.
- ATR take-profit: A target is placed a (typically larger) multiple of ATR away from entry.
- Whichever of these three exits triggers first closes the trade. The system also holds only one position at a time per magic number.
Strategy Parameters
| Parameter | Default | Min | Max | Description |
|---|---|---|---|---|
| EmaPeriod | 20 | 10 | 60 | Period of the short EMA used as the "mean" for the disparity calculation. Lower values react faster; higher values smooth more. |
| DisparityThreshold | 0.35 | 0.10 | 2.00 | The absolute disparity percentage that must be reached before a reversion signal is considered. Larger values demand a bigger stretch. |
| TrendPeriod | 100 | 50 | 300 | Period of the long EMA whose slope defines the market regime (up, down, or flat). |
| SlopeLookback | 5 | 2 | 20 | Number of bars back used to measure the long EMA's slope. |
| SlopeThreshold | 0.05 | 0.00 | 0.50 | Minimum normalized slope (in ATR units) required to classify the market as trending rather than flat. |
| AtrPeriod | 14 | 7 | 30 | Period of the ATR used for slope normalization and for sizing the stop-loss and take-profit. |
| SlMultiplier | 1.5 | 0.5 | 4.0 | ATR multiple that sets the stop-loss distance from entry. |
| TpMultiplier | 2.5 | 0.5 | 6.0 | ATR multiple that sets the take-profit distance from entry. |
| Lots | 0.10 | 0.01 | 1.0 | Trade volume in lots. Should be sized to your account and risk tolerance. |
Recommended Chart Settings
The Disparity Band Reversion EA is a single-timeframe system: every calculation uses the chart's own timeframe, so you attach it to one chart and let it work there. Mean-reversion logic with an ATR-based stop tends to be studied most naturally on liquid instruments during active market hours, where the short EMA and ATR readings are meaningful.
A common starting point for study is a major FX pair (for example EUR/USD) on an intraday timeframe such as M15 or H1, which gives enough bars for the 100-period trend EMA to warm up while still producing regular signals. That said, the default parameters are a neutral baseline, not an optimized setting. Behavior will vary considerably across different symbols, timeframes, spreads, and market conditions, so treat any chart choice as a hypothesis to test rather than a recommendation. Always confirm the instrument's spread and volatility profile suit a reversion approach before committing to it.
How to Install on MetaTrader 5
- Download the
.ex5file from the link below - Copy it to your MT5
MQL5\Expertsfolder - Restart MetaTrader 5 or refresh the Navigator panel
- Drag the EA onto a chart matching the recommended symbol and timeframe
- Configure the input parameters and enable Algo Trading
What to Consider Before Using This EA
Every strategy has a personality — conditions where its logic fits, and conditions where it struggles. Understanding both is the point of studying it.
Strengths of this approach:
- The regime filter is the key design idea. Pure mean-reversion systems are notorious for repeatedly buying into falling markets. By only allowing with-trend or flat-market reversions, this strategy specifically tries to sidestep the most common source of false signals.
- Volatility-adaptive risk. Because stops and targets scale with ATR, the strategy automatically widens its risk distance in volatile conditions and tightens it in quiet ones, rather than using fixed pip values.
- Objective, bar-close signals. Acting once per completed bar removes intrabar noise and makes the rules easy to backtest and reason about.
Known limitations:
- Reversion strategies underperform in strong, persistent trends. The slope filter helps, but no filter is perfect. A market that grinds one direction with shallow slope readings can still generate losing counter-moves.
- Whipsaw in choppy transitions. When the market flips between flat and trending faster than the long EMA can register, the regime label may lag, producing entries the strategy would have avoided with hindsight.
- Single position, single timeframe. Holding only one position at a time is simple and safe, but it also means the system sits idle while a trade is open, potentially missing other setups.
- Parameter sensitivity. The disparity threshold, slope threshold, and ATR multiples interact. Small changes can meaningfully shift how often the strategy trades and how it manages risk, so thoughtful testing matters more than any single "best" setting.
None of this makes the approach good or bad in the abstract — it makes it a specific tool with a specific comfort zone. Your job as a student of the market is to learn where that zone is.
Risk Management Tips
Sound risk management matters more than any entry signal. As you study this or any strategy, keep these principles in mind:
- Risk a small, fixed fraction per trade. A widely taught guideline is to risk no more than 1–2% of account equity on any single position. Size your lots so the ATR-based stop distance stays within that limit.
- Test on a demo account first. Run the EA on a demo or simulated account long enough to see it behave across different market conditions before considering any live use.
- Understand drawdown. Even a well-behaved reversion system will have losing streaks. Study its historical drawdown so the emotional experience of a losing run does not surprise you.
- Never over-leverage. Leverage magnifies both gains and losses. Keep position sizes conservative relative to account balance.
- Keep a trading journal. Recording why each trade triggered and how it resolved turns raw results into genuine learning.
Risk Warning
Trading foreign exchange, CFDs, and other leveraged financial instruments involves substantial risk of loss and is not suitable for all investors. The strategies and tools discussed on this page are provided for educational purposes only and do not constitute financial advice, investment recommendations, or solicitation to trade. Always consult a qualified financial adviser before making trading decisions. Past backtest performance is not indicative of future results.
Downloads
- Expert Advisor: DisparityBandReversion.ex5 (70 downloads)
- Source Code: DisparityBandReversion.mq5 (61 downloads)
- Documentation: DisparityBandReversion.pdf (69 downloads)