Disclaimer: This article is for educational and informational purposes only. It does not constitute financial or investment advice. Trading forex and CFDs carries significant risk of loss. Past performance of any strategy — including backtests — does not guarantee future results. Never trade with money you cannot afford to lose.
What Is This Strategy?
The Directional Triangle Breakout is a price-action (chart-pattern) breakout strategy built around the classic ascending and descending triangle — two of the most widely taught converging-range formations in technical analysis. Unlike a symmetric "squeeze" or "coil" pattern, which gives no hint of which way price will resolve, a triangle carries an intrinsic directional bias. That bias is exactly what this strategy tries to read and then trade in a disciplined, rule-based way.
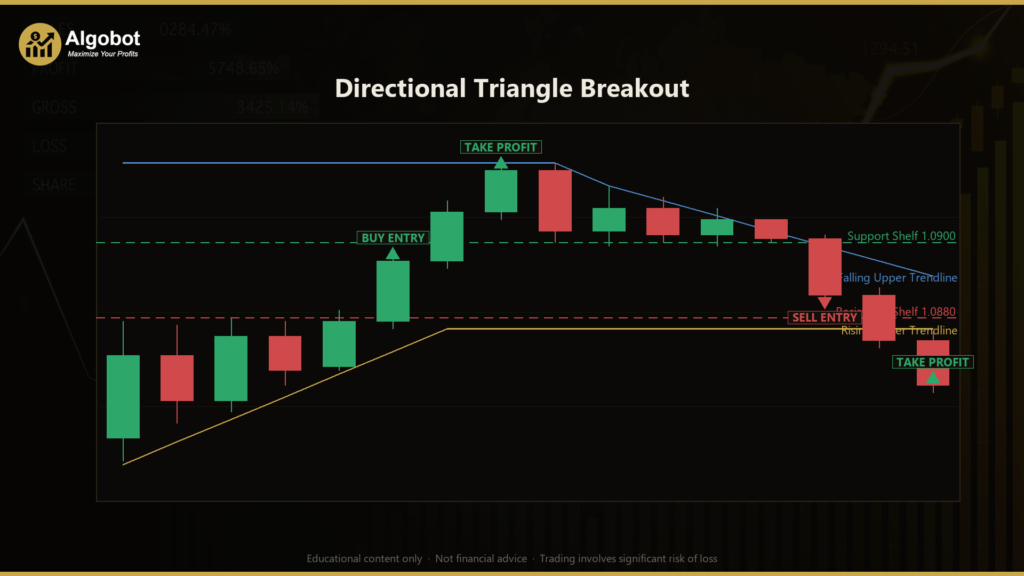
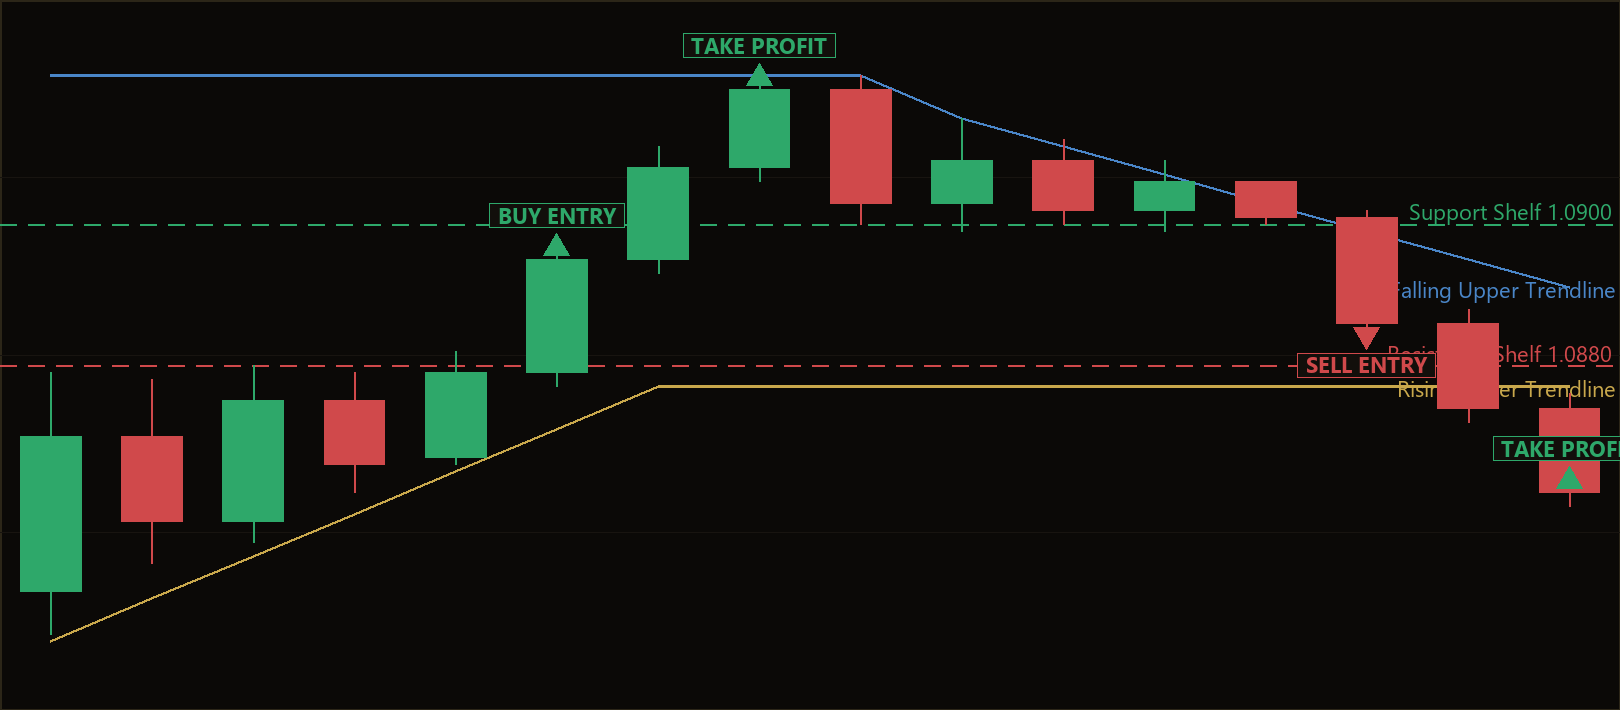
A triangle forms when one boundary of price stays roughly flat — acting as a firm "shelf" of supply or demand — while the other boundary steadily converges toward it. In an ascending triangle, the highs form a flat ceiling (resistance) while the lows keep rising, suggesting buyers are absorbing the fixed supply and pressure is building upward. In a descending triangle, the lows form a flat floor (support) while the highs keep falling, suggesting sellers are pressing into a fixed demand shelf and pressure is building downward. The strategy fits least-squares regression lines to both the highs and the lows, normalizes their slopes by the Average True Range (ATR) — a common volatility measure — so the thresholds are scale-free, and confirms that the range is genuinely narrowing before acting.
As a learning tool, this strategy is well suited to traders who want to study how discretionary chart patterns can be translated into precise, objective, mechanical rules. It demonstrates regression-based slope measurement, volatility normalization, convergence testing, and confirmed-breakout entry logic — all concepts that transfer to many other systems. It is best viewed as an analytical framework for understanding pattern-based breakouts, not as a shortcut to trading success.
How It Works
The strategy evaluates the market once per completed bar and measures the triangle geometry over a fixed window of bars preceding the potential breakout bar. Here is what happens, step by step:
- Measuring the two boundaries: The strategy fits a least-squares regression line to the bar highs (giving
slopeH) and another to the bar lows (givingslopeL) over theLookbackwindow. Both slopes are divided by the ATR so they are expressed in "ATR per bar," making them comparable across any symbol or timeframe. - Confirming convergence: The window is split in half. The high-to-low range of the more recent half must be materially narrower than the range of the earlier half (recent range ≤ earlier range ×
ConvergeRatio). This verifies the pattern is actually coiling, not just drifting sideways. - Arming a direction:
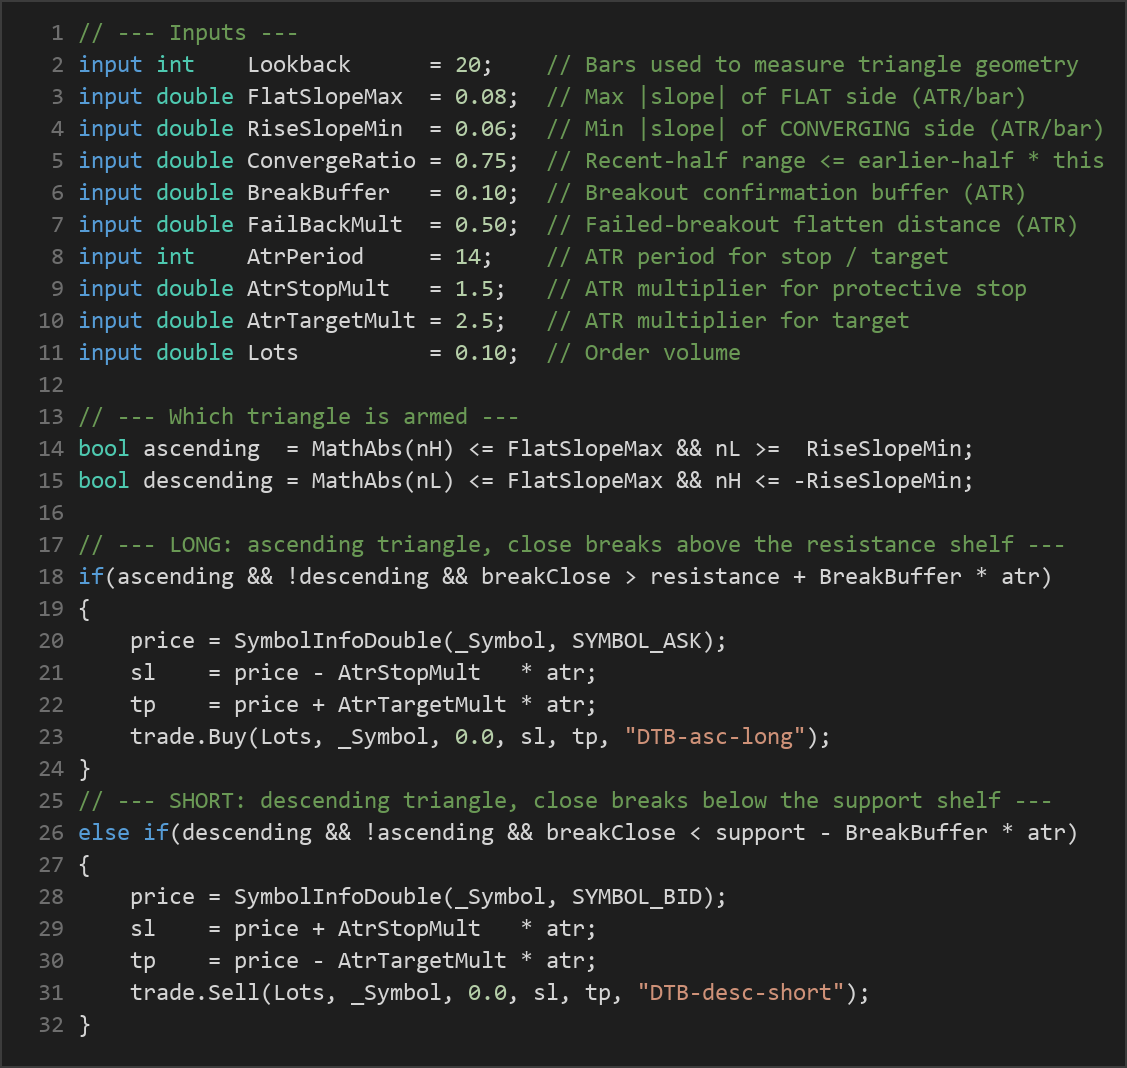
- An ascending triangle is recognized when the top is roughly flat (
|slopeH|≤FlatSlopeMax) and the bottom is rising (slopeL≥RiseSlopeMin). This arms the long side. - A descending triangle is recognized when the bottom is roughly flat (
|slopeL|≤FlatSlopeMax) and the top is falling (slopeH≤-RiseSlopeMin). This arms the short side. - The breakout entry: A pattern only arms a side — it does not trade on its own. The strategy signals an entry only on the first completed bar that closes beyond the flat shelf by a small volatility buffer:
- Long when an ascending triangle is armed and the close is above
resistance + BreakBuffer × ATR. - Short when a descending triangle is armed and the close is below
support − BreakBuffer × ATR. - Here,
resistanceis the highest high andsupportis the lowest low of the pattern window — the shelf that was in place before the breakout bar, so the break is genuinely fresh. - Stop-loss logic: On entry, a protective stop is placed at
AtrStopMult × ATRaway from the fill price — below entry for longs, above entry for shorts. Because it is ATR-based, the stop automatically widens in volatile conditions and tightens in quiet ones. - Take-profit logic: A target is set at
AtrTargetMult × ATRfrom entry. With the default multipliers (1.5 stop, 2.5 target), the target is farther than the stop, creating an asymmetric reward-to-risk profile. - Failed-breakout exit: If a completed bar closes back through the broken shelf by
FailBackMult × ATR— a long slipping back below the old resistance, or a short popping back above the old support — the break is treated as rejected and the position is flattened early, before the full stop is reached. - One position at a time: The strategy holds a single position per magic number, so it manages the current trade fully before looking for a new pattern.
Strategy Parameters
| Parameter | Default | Min | Max | Description |
|---|---|---|---|---|
| Lookback | 20 | 10 | 60 | Number of bars used to measure the triangle geometry (the shelf plus the converging side). |
| FlatSlopeMax | 0.08 | 0.02 | 0.30 | Maximum absolute slope of the flat side, in ATR per bar. Smaller values require a flatter, cleaner shelf. |
| RiseSlopeMin | 0.06 | 0.01 | 0.30 | Minimum absolute slope of the converging side, in ATR per bar. Larger values demand a clearer directional bias. |
| ConvergeRatio | 0.75 | 0.40 | 1.00 | Convergence gate: the recent-half range must be ≤ the earlier-half range × this value. Lower means tighter coiling is required. |
| BreakBuffer | 0.10 | 0.00 | 0.60 | Breakout confirmation buffer beyond the shelf, in ATR. Larger values demand a more decisive close through the shelf. |
| FailBackMult | 0.50 | 0.10 | 1.50 | Failed-breakout exit: a close back through the shelf by this × ATR flattens the trade early. |
| AtrPeriod | 14 | 7 | 30 | Averaging period for the ATR used in slope normalization, stop, and target. |
| AtrStopMult | 1.5 | 1.0 | 4.0 | ATR multiplier for the protective stop-loss distance. |
| AtrTargetMult | 2.5 | 1.0 | 6.0 | ATR multiplier for the take-profit target distance. |
| Lots | 0.10 | 0.01 | 1.0 | Order volume (position size) in lots. |
Recommended Chart Settings
This strategy is designed as a single-timeframe system: every calculation uses the symbol and timeframe of the chart it is attached to. It contains no hard-coded symbol assumptions, so it can be studied on major forex pairs, indices, or other liquid instruments where triangle patterns commonly appear.
A practical starting point for study is a liquid major such as EUR/USD on the H1 (1-hour) timeframe, which tends to produce enough bars for the regression and convergence tests to be meaningful while still generating a reasonable number of patterns. Higher timeframes (H4, D1) generally yield fewer but structurally cleaner triangles, whereas lower timeframes produce more signals along with more noise. Because breakout behavior varies substantially with volatility and liquidity, results will differ across symbols, sessions, and market conditions — always test any configuration on your own data before drawing conclusions.
How to Install on MetaTrader 5
- Download the .ex5 file from the link below
- Copy it to your MT5
MQL5\Expertsfolder - Restart MetaTrader 5 or refresh the Navigator panel
- Drag the EA onto a chart matching the recommended symbol and timeframe
- Configure the input parameters and enable Algo Trading
What to Consider Before Using This EA
Like every mechanical system, the Directional Triangle Breakout has clear strengths and equally clear limitations that are worth understanding before you rely on it.
Strengths of this approach:
- Objective pattern recognition. Triangles are often drawn subjectively by hand. This strategy replaces "eyeballing" trendlines with least-squares regression and a numeric convergence test, so the same chart always produces the same reading.
- A built-in directional thesis. Because ascending and descending triangles carry a directional bias, entries are aligned with the side that has been quietly accumulating pressure, rather than guessing at random on a neutral coil.
- Volatility-aware. ATR normalization means slope thresholds, breakout buffers, stops, and targets all scale with current volatility instead of using fixed pip distances.
- Confirmation-based entries. Requiring a closing break beyond the shelf, plus a small buffer, filters out many of the intrabar "fakeouts" that trap breakout traders.
Known limitations:
- False breakouts are inherent to breakouts. Even confirmed closes through a shelf can reverse. The failed-breakout exit is designed to reduce the damage, but it cannot eliminate losing trades.
- Range-bound and choppy markets can be unkind. In directionless, low-conviction conditions, price may repeatedly poke through and fall back, producing a string of small losses.
- Pattern scarcity. Strict geometry filters mean valid triangles do not appear on every window; the strategy may sit idle for long stretches, which some traders find difficult to accept.
- Parameter sensitivity. Slope thresholds and the convergence ratio strongly shape which patterns qualify. Over-tuning them to past data ("curve fitting") can create results that historically looked strong but fail to generalize.
This EA is best understood as an educational illustration of how a discretionary chart pattern can be encoded into precise rules — not as a finished, market-ready system. Any live use should follow extensive independent testing.
Risk Management Tips
Sound risk management matters far more than any single entry signal. Consider these general principles as you study this or any strategy:
- Risk a small, fixed fraction per trade. Many educational sources suggest risking no more than 1–2% of account equity on any single position, so that a series of losses cannot severely damage your account.
- Size positions deliberately. Choose your lot size based on the distance to your stop-loss and your chosen risk percentage — not on a desire for larger wins.
- Always test on a demo account first. Run the strategy in a risk-free simulated environment until you understand its behavior across trending, ranging, and volatile conditions.
- Understand drawdown. Every strategy experiences losing streaks. Know the largest peak-to-trough decline you can tolerate emotionally and financially before committing real capital.
- Account for costs. Spreads, commissions, and slippage all affect real-world outcomes, especially for breakout systems that enter as price is moving quickly.
- Avoid over-optimization. Parameters that fit past data perfectly often perform poorly going forward. Favor robust settings that work reasonably across many conditions.
Risk Warning
Trading foreign exchange, CFDs, and other leveraged financial instruments involves substantial risk of loss and is not suitable for all investors. The strategies and tools discussed on this page are provided for educational purposes only and do not constitute financial advice, investment recommendations, or solicitation to trade. Always consult a qualified financial adviser before making trading decisions. Past backtest performance is not indicative of future results.
Downloads
- Expert Advisor: DirectionalTriangleBreakout.ex5 (20 downloads)
- Source Code: DirectionalTriangleBreakout.mq5 (23 downloads)
- Documentation: DirectionalTriangleBreakout.pdf (25 downloads)