Disclaimer: This article is for educational and informational purposes only. It does not constitute financial or investment advice. Trading forex and CFDs carries significant risk of loss. Past performance of any strategy — including backtests — does not guarantee future results. Never trade with money you cannot afford to lose.
What Is This Strategy?
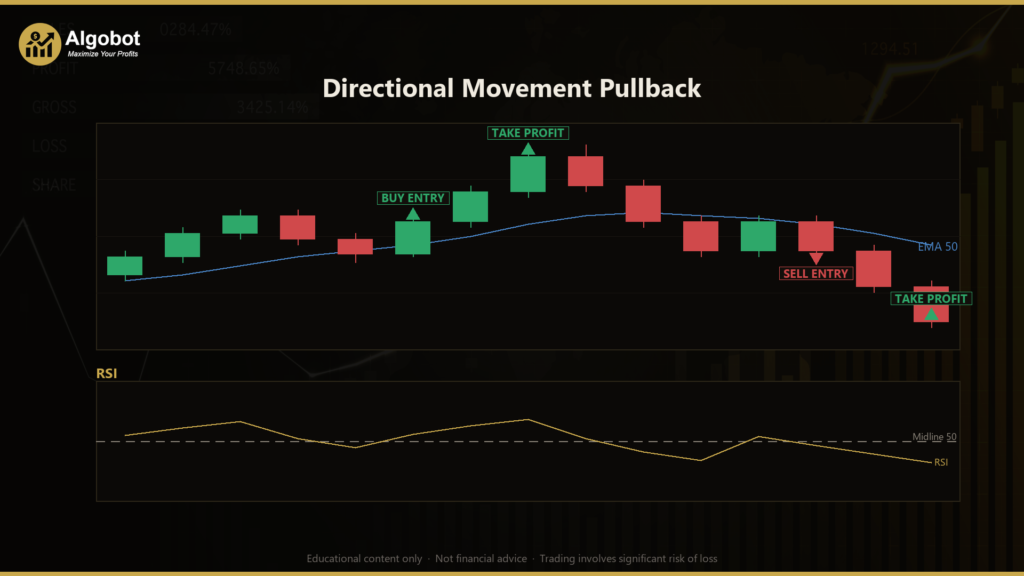
The Directional Movement Pullback is a trend-following, pullback-continuation trading system built around Wilder's Directional Movement Index (DMI) — the family of indicators that includes the +DI line, the -DI line, and the Average Directional Index (ADX). In plain terms, the DMI measures whether a market is trending and, if so, in which direction, while the ADX measures how strong that trend is. This strategy pairs that regime filter with an Exponential Moving Average (EMA) baseline and a Relative Strength Index (RSI) timing trigger to enter in the direction of an established trend after a brief pause, or "pullback."
Rather than trying to predict tops and bottoms, the Directional Movement Pullback is designed for markets that are already moving with conviction. It waits for the ADX to confirm a strong trend, checks that +DI and -DI agree on the trend's direction, requires price to sit on the correct side of the EMA, and only then acts when momentum resumes in the trend's favor. This makes it a study in continuation trading — joining a move that is already underway instead of chasing extremes.
As a learning tool, this strategy is well suited to traders who want to understand how multiple confirming indicators can be combined into a single, rule-based system. It demonstrates non-repainting indicator logic, ATR-based risk placement, and a disciplined "one trade at a time" approach. Treat it as a framework for studying trend-continuation mechanics — not as a shortcut to any particular outcome.
How It Works
The strategy evaluates its rules only on the close of each completed bar, which keeps its signals non-repainting (they do not change after the fact). Here is how the logic flows:
- Regime filter (ADX): The strategy calculates the ADX using Wilder's smoothing. A trade is only considered when the ADX reads above the
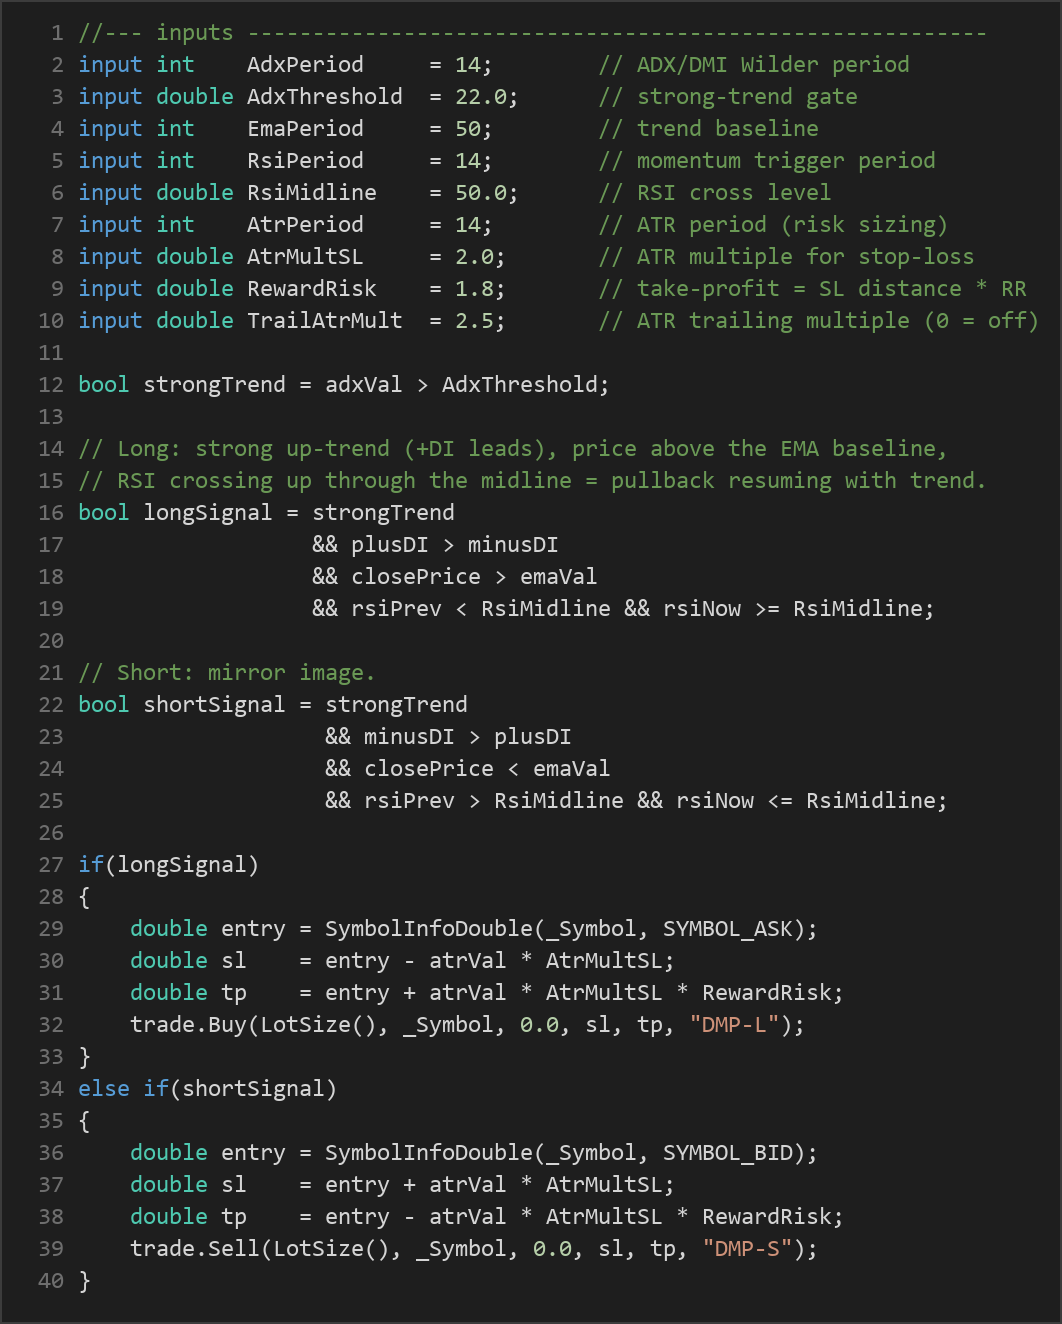
AdxThreshold(default 22), which is the strategy's definition of a "strong trend." When the ADX is below this level, the market is treated as too directionless to trade. - Direction agreement (+DI / -DI): For a long setup, the +DI line must be above the -DI line, signalling that buyers are in control. For a short setup, the -DI must lead the +DI.
- Trend baseline (EMA): Price must confirm the direction. Longs require the closed price to be above the EMA (default period 50); shorts require it to be below the EMA.
- Timing trigger (RSI midline cross): The strategy waits for the RSI to cross the midline (default 50) in the trend's direction. For a long, the RSI must move from below the midline on the prior bar to at or above it on the signal bar — a sign that momentum is resuming after a pullback. For a short, the RSI crosses from above the midline down through it.
- Entry: When all conditions align, the strategy signals an entry — buying at the ask for longs, or selling at the bid for shorts.
For exits and risk control, the logic is symmetrical and driven by the Average True Range (ATR), a measure of recent volatility:
- Stop-loss: Placed at a distance of
AtrMultSL× ATR from entry (default 2.0 × ATR). Wider volatility produces a wider stop. - Take-profit: Set at the stop distance multiplied by the
RewardRiskratio (default 1.8), so the target reward is larger than the risk taken. - Trailing stop: If
TrailAtrMultis greater than zero (default 2.5), the strategy trails the stop behind price by that ATR multiple, evaluated on each closed bar. The stop only ever moves in the favorable direction, helping lock in open gains as a trend extends. - One position per magic number: The strategy holds only a single position at a time, avoiding stacked or conflicting orders.
Strategy Parameters
| Parameter | Default | Min | Max | Description |
|---|---|---|---|---|
| AdxPeriod | 14 | 10 | 30 | Wilder period for the ADX/DMI calculation that gauges trend strength and direction. |
| AdxThreshold | 22.0 | 15.0 | 40.0 | Minimum ADX reading required to treat the market as a "strong trend." Higher values demand stronger trends. |
| EmaPeriod | 50 | 20 | 200 | Period of the EMA trend baseline. Price must be above it for longs, below it for shorts. |
| RsiPeriod | 14 | 7 | 28 | Lookback period for the RSI momentum trigger. |
| RsiMidline | 50.0 | 40.0 | 60.0 | The RSI level whose crossing signals momentum resuming in the trend direction. |
| AtrPeriod | 14 | 7 | 30 | Period of the ATR used to size stops, targets, and the trailing stop. |
| AtrMultSL | 2.0 | 1.0 | 4.0 | ATR multiple that sets the stop-loss distance from entry. |
| RewardRisk | 1.8 | 1.0 | 4.0 | Take-profit distance expressed as a multiple of the stop distance. |
| TrailAtrMult | 2.5 | 0.0 | 5.0 | ATR multiple for the trailing stop. Set to 0 to disable trailing. |
| Lots | 0.10 | 0.01 | 2.0 | Base position size in lots. |
| EquityScaling | 1.0 | 0.0 | 2.0 | Compounding factor: 0 keeps size fixed, 1 scales proportionally with equity, above 1 is more aggressive. |
| MaxLots | 5.0 | 0.1 | 50.0 | Hard ceiling on position size after any equity scaling. |
| MaxSpread | 30 | 5 | 100 | Maximum allowable spread (in points) for a new trade to be opened. |
Recommended Chart Settings
This strategy is a single-timeframe system: every calculation reads the chart's own symbol and timeframe. It is generally best studied on a liquid instrument with clean trends — major forex pairs such as EUR/USD or GBP/USD are common starting points — on intraday-to-swing timeframes like the H1 (1-hour) or H4 (4-hour) chart, where the ADX and EMA have room to define meaningful trends. Because it relies on strong directional movement, it tends to be less active on very short, noisy timeframes. Remember that behavior will vary considerably across different symbols, timeframes, and market conditions, so any settings should be studied on your own charts before drawing conclusions.
How to Install on MetaTrader 5
- Download the .ex5 file from the link below
- Copy it to your MT5
MQL5\Expertsfolder - Restart MetaTrader 5 or refresh the Navigator panel
- Drag the EA onto a chart matching the recommended symbol and timeframe
- Configure the input parameters and enable Algo Trading
What to Consider Before Using This EA
The Directional Movement Pullback has clear conceptual strengths. By requiring the ADX, the +DI/-DI relationship, the EMA, and an RSI cross to all agree before entering, it filters out a large amount of noise and only acts on well-defined continuation setups. Its non-repainting design and ATR-based risk placement mean that stops and targets adapt to current volatility rather than using fixed distances that ignore market conditions.
However, every approach has trade-offs. Multi-filter trend systems like this one are, by design, selective — they may sit out of the market for long stretches and can miss fast moves that never produce a clean pullback. Their main weakness is the ranging or choppy market: when the ADX hovers near its threshold, the strategy can whipsaw, entering just as a false breakout fades. The RSI midline cross can also fire late, meaning entries sometimes occur after a good portion of a swing has already passed. Trend-following methods historically endure sequences of small losing trades punctuated by fewer, larger wins, which demands patience and consistent execution. Study how the strategy behaves across both trending and sideways periods before forming any expectations.
Risk Management Tips
Sound risk management matters far more than any single indicator setting. Consider these general principles as you study this or any strategy:
- Risk a small, fixed fraction per trade. Many educators suggest limiting the risk on any one position to roughly 1–2% of account equity, so a losing streak cannot do outsized damage.
- Size positions deliberately. Use the
Lots,EquityScaling, andMaxLotsinputs to keep exposure aligned with your account size, and be cautious with aggressive compounding. - Test on a demo account first. Run the strategy in a risk-free simulated environment until you understand its rhythm, frequency, and drawdown behavior.
- Understand drawdown. Every strategy experiences peak-to-trough declines. Know the largest drawdown you are prepared to tolerate before committing real capital.
- Never trade money you cannot afford to lose, and keep expectations grounded in the reality that no set of rules can eliminate risk.
Risk Warning
Trading foreign exchange, CFDs, and other leveraged financial instruments involves substantial risk of loss and is not suitable for all investors. The strategies and tools discussed on this page are provided for educational purposes only and do not constitute financial advice, investment recommendations, or solicitation to trade. Always consult a qualified financial adviser before making trading decisions. Past backtest performance is not indicative of future results.
Downloads
- Expert Advisor: DirectionalMovementPullback.ex5 (60 downloads)
- Source Code: DirectionalMovementPullback.mq5 (55 downloads)
- Documentation: DirectionalMovementPullback.pdf (59 downloads)