
Disclaimer: This article is for educational and informational purposes only. It does not constitute financial or investment advice. Trading forex and CFDs carries significant risk of loss. Past performance of any strategy — including backtests — does not guarantee future results. Never trade with money you cannot afford to lose.
What Is This Strategy?
The Deviation Scaled Trend Cross is a trend-following pullback strategy built around John Ehlers' Deviation-Scaled Moving Average (DSMA), an adaptive baseline that speeds up or slows down according to the statistical significance of recent price momentum. Unlike a fixed exponential moving average (EMA), the DSMA measures how large the current momentum is relative to its own recent variability and only reacts strongly when a move stands out from the noise. That makes it a natural centre-line for timing entries in a trending market while filtering out the chop that normally triggers false signals.
At its core, the strategy tries to solve a classic problem for trend traders: how do you re-enter an established trend after a pullback without getting whipsawed every time price wobbles? The DSMA answers this by acting as a "smart" moving average. When momentum is strong and directional, the average accelerates to hug price closely; when the market drifts sideways, the average idles and stays smooth. Price pulling back to — and then reclaiming — this adaptive line is treated as a potential trend-continuation signal.
This strategy is best understood as a learning tool for traders who want to study adaptive moving averages, regime filtering, and pullback entries. It is designed for trending market conditions and is not intended for ranging or choppy environments, where any trend-following system tends to struggle. If you are studying how Ehlers-style digital signal processing filters translate into practical entry logic, the Deviation Scaled Trend Cross offers a clean, self-contained example.
How It Works
The strategy operates only on closed bars (it ignores the still-forming candle) and builds the DSMA step by step. Here is what happens on each new bar, in plain English:
- Build the momentum series — The strategy first computes a crude momentum value,
Close − Close[2](the change in price over two bars). This acts as a high-pass filter that emphasises recent movement. - Smooth it — That momentum series is passed through Ehlers' 2-pole SuperSmoother, a low-pass filter that removes short-term noise while introducing very little lag.
- Measure the deviation — The strategy calculates the RMS (root-mean-square, a running measure of typical size) of the smoothed momentum over the
Lengthwindow. This is the "deviation scale." - Normalise momentum — Dividing the smoothed momentum by its RMS expresses it in standard-deviation units (
ScaledFilt). A value of 2, for example, means momentum is twice its typical recent size. - Adapt the smoothing — The smoothing constant
alphagrows with the absolute value of this normalised momentum. Large, significant thrusts make the DSMA fast; quiet noise keeps it slow.
Once the DSMA baseline exists, the trade logic layers on top:
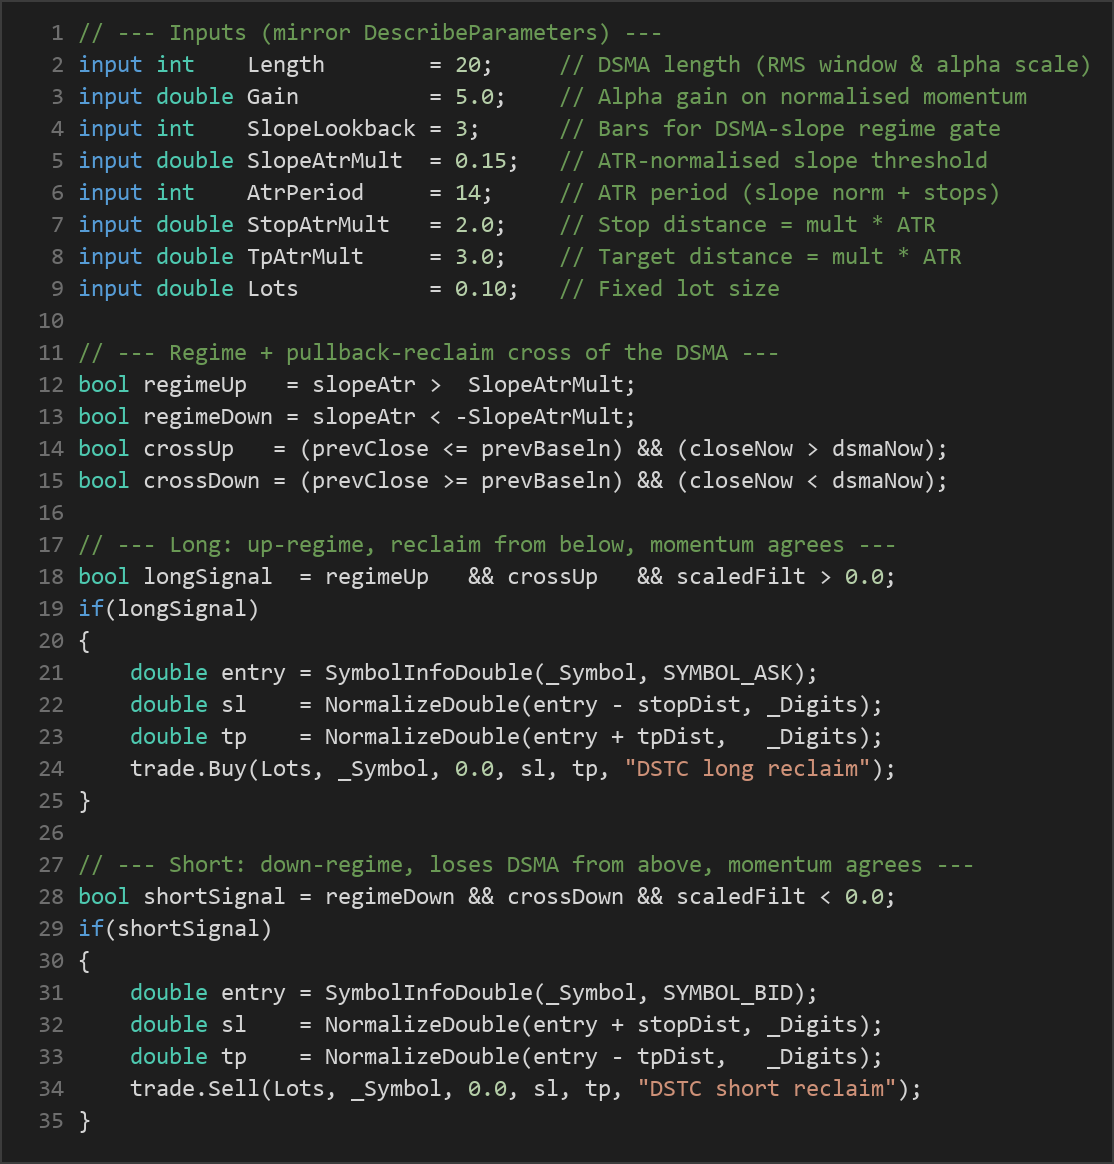
- Regime gate — The strategy measures the DSMA's slope over
SlopeLookbackbars and divides it by the current ATR (Average True Range, a volatility measure). If this normalised slope exceedsSlopeAtrMult, the market is considered an up-regime (long-only). If it is below the negative of that threshold, it is a down-regime (short-only). Weak slopes produce no regime and no trades. - Entry (pullback reclaim) — In an up-regime, the strategy signals a long when price closes back above the DSMA after having been at or below it (a reclaim from below), and the normalised momentum sign agrees (positive). In a down-regime, it signals a short when price closes back below the DSMA, with negative momentum agreement.
- Exit — An open position is closed on an opposite DSMA cross. A long exits if price crosses back below the DSMA; a short exits if price crosses back above it.
- Stop-loss — Every trade places a stop at
StopAtrMult × ATRaway from entry, so the risk distance scales with current volatility. - Take-profit — A target is set at
TpAtrMult × ATRfrom entry, again scaled to volatility.
The strategy holds only one position at a time and tags each trade with the Magic number so it can manage its own orders without interfering with other trades on the account.

Strategy Parameters
| Parameter | Default | Min | Max | Description |
|---|---|---|---|---|
| Length | 20 | 8 | 48 | DSMA length — sets both the RMS deviation window and the alpha smoothing scale. Higher values give a smoother, slower baseline. |
| Gain | 5.0 | 2.0 | 10.0 | Multiplier applied to normalised momentum when computing alpha. Higher gain makes the DSMA react faster to significant thrusts. |
| SlopeLookback | 3 | 1 | 12 | Number of bars used to measure the DSMA slope for the regime gate. Larger values smooth the trend read. |
| SlopeAtrMult | 0.15 | 0.0 | 1.5 | ATR-normalised slope threshold a regime must exceed. Higher values demand a steeper, more established trend before trading. |
| AtrPeriod | 14 | 5 | 40 | Period of the ATR used for slope normalisation and for sizing the stop and target. |
| StopAtrMult | 2.0 | 0.5 | 6.0 | Stop-loss distance as a multiple of ATR. Larger values give the trade more room but increase risk per trade. |
| TpAtrMult | 3.0 | 0.5 | 10.0 | Take-profit distance as a multiple of ATR. Sets the reward side of the risk-to-reward ratio. |
| Lots | 0.10 | 0.01 | 1.0 | Fixed position size in lots for each trade. |
Recommended Chart Settings
The Deviation Scaled Trend Cross was designed as a single-timeframe strategy for major forex pairs such as EUR/USD on an intraday-to-swing timeframe like the H1 (1-hour) or H4 (4-hour) chart, where trends have room to develop and the ATR-based stops have meaningful context. Because the DSMA and the ATR both adapt to the instrument's own volatility, the logic can be studied on other liquid symbols as well.
Keep in mind that results will vary considerably across different symbols, timeframes, and market conditions. An adaptive trend system behaves very differently in a persistent trend than it does in a tight range, so always test on a demo account across a variety of periods before drawing conclusions.
How to Install on MetaTrader 5
- Download the .ex5 file from the link below
- Copy it to your MT5
MQL5\Expertsfolder - Restart MetaTrader 5 or refresh the Navigator panel
- Drag the EA onto a chart matching the recommended symbol and timeframe
- Configure the input parameters and enable Algo Trading
What to Consider Before Using This EA
Strengths. The main appeal of this approach is the adaptive baseline. Because the DSMA accelerates onto statistically significant momentum and idles through noise, it historically reacts faster than a fixed EMA during genuine trends while producing fewer whipsaws in quiet conditions. The regime gate adds a second layer of filtering, so the strategy only takes pullback entries when the DSMA slope confirms a directional bias. Combined with volatility-scaled stops and targets, the logic is internally consistent and adapts its risk distances to current market conditions.
Limitations. No adaptive moving average eliminates lag entirely — it only reduces it. During sharp reversals, the DSMA can still be caught on the wrong side, and the "opposite cross" exit may give back part of an open profit before triggering. Like all trend-following systems, the Deviation Scaled Trend Cross may underperform in range-bound or news-driven markets, where price repeatedly crosses the baseline without following through. The single-position, one-trade-at-a-time design keeps risk simple but also means missed opportunities when multiple setups appear.
Sensitivity. Performance depends heavily on the Length, Gain, and SlopeAtrMult settings. A regime threshold that is too low may admit weak, choppy trends; one that is too high may filter out most trades. Treat parameter tuning as a study exercise, and be cautious of over-fitting settings to a single historical period.
Risk Management Tips
Sound risk management matters far more than any single indicator. Consider these general principles as you study this strategy:
- Risk a small, fixed fraction per trade. Many educational sources suggest risking no more than 1–2% of account equity on any one position. Adjust the
LotsandStopAtrMultinputs so the worst-case loss stays within that limit. - Understand drawdown. Even a well-designed trend system experiences losing streaks. Study the maximum drawdown in testing so you know what to expect emotionally and financially.
- Use a demo account first. Run the strategy on a demo or simulated account across many months of data before considering any live use. This helps you understand its behaviour in different regimes.
- Respect the stop-loss. The ATR-scaled stop is central to this design. Disabling or widening it defeats the volatility-aware risk framework built into the logic.
- Diversify your study. Do not judge a strategy on a handful of trades. A larger sample across conditions gives a more honest picture of how it behaves.
Risk Warning
Trading foreign exchange, CFDs, and other leveraged financial instruments involves substantial risk of loss and is not suitable for all investors. The strategies and tools discussed on this page are provided for educational purposes only and do not constitute financial advice, investment recommendations, or solicitation to trade. Always consult a qualified financial adviser before making trading decisions. Past backtest performance is not indicative of future results.
Downloads
- Expert Advisor: DeviationScaledTrendCross.ex5 (31 downloads)
- Source Code: DeviationScaledTrendCross.mq5 (29 downloads)
- Documentation: DeviationScaledTrendCross.pdf (39 downloads)