Disclaimer: This article is for educational and informational purposes only. It does not constitute financial or investment advice. Trading forex and CFDs carries significant risk of loss. Past performance of any strategy — including backtests — does not guarantee future results. Never trade with money you cannot afford to lose.
What Is This Strategy?
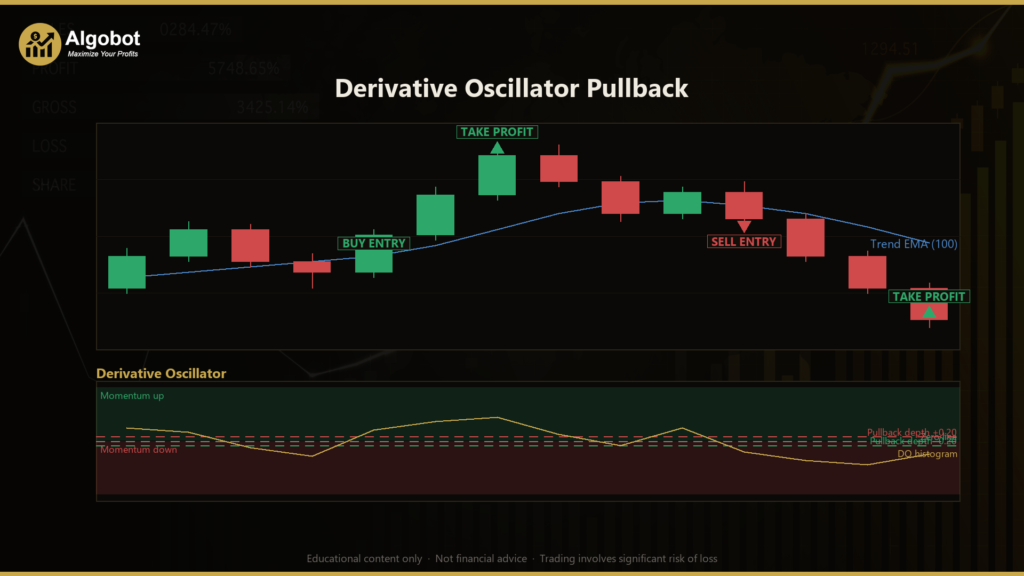
The Derivative Oscillator Pullback is a trend-following pullback strategy built around Constance Brown's Derivative Oscillator, a momentum tool that refines the classic Relative Strength Index (RSI) into a cleaner, lower-lag signal. Rather than trading raw RSI zig-zags — which tend to be noisy and hard to time — this approach smooths the RSI twice and subtracts a moving-average signal line, producing a momentum histogram whose zero crossings mark the moment momentum flips direction. The strategy uses that histogram not to fade the market, but to time re-entries after a pullback within an existing trend.
At its core, the Derivative Oscillator is a "double-smoothed RSI minus a signal line." An RSI on its own reacts too quickly and whipsaws; a single moving average of RSI lags too much. Brown's insight was to apply an exponential moving average (EMA) of an EMA to the RSI, then subtract a simple moving average (SMA) of that smoothed series. The result is a near-zero-lag histogram that turns negative when an up-move stalls and positive when a down-move stalls — a compact read on whether momentum is pausing or resuming.
This strategy is designed for trending market conditions on major currency pairs and is best suited to traders who want to study how trend-following and pullback timing work together. It is a learning tool for understanding momentum smoothing, regime filters, and volatility-based risk placement — not a shortcut to results. If you are exploring how to buy dips in an uptrend (or sell bounces in a downtrend) using a disciplined, rules-based signal, this is a useful case study.
How It Works
The strategy combines a trend filter, a pullback requirement, and a momentum trigger. All logic is fully symmetric between long and short setups. Here is how the strategy signals a trade:
- Regime filter (trend direction): A long EMA of price (the
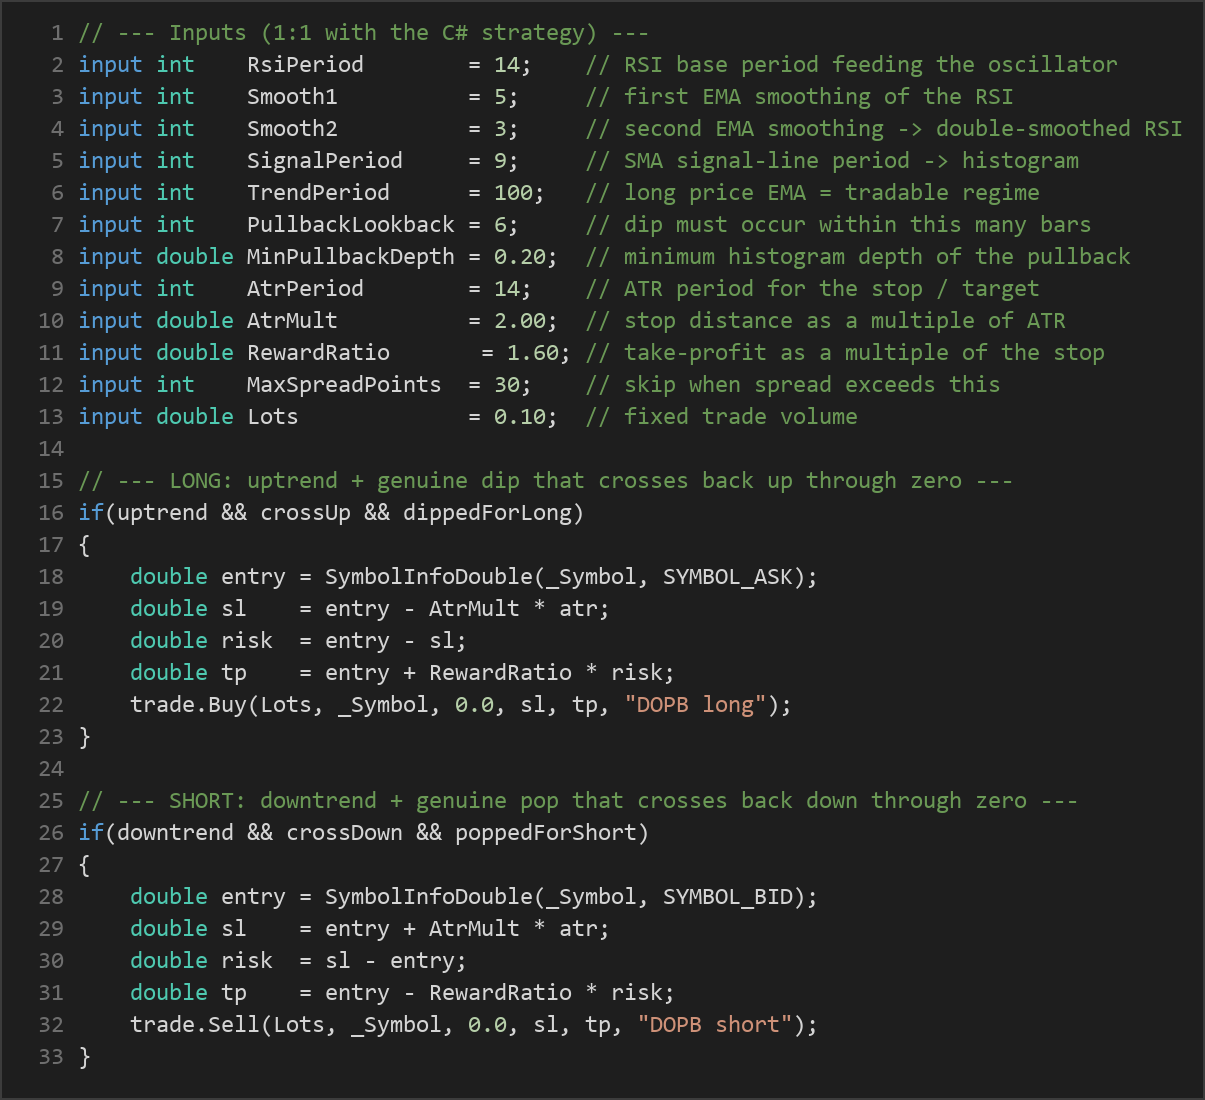
TrendPeriodEMA) defines the tradable regime. When price closes above the trend EMA, only long setups are considered; when price closes below it, only short setups are considered. The strategy never trades against the higher-order trend. - Pullback requirement (the dip must be real): Within the trend, the Derivative Oscillator histogram must have actually dipped against the trend by at least
MinPullbackDepthover the lastPullbackLookbackbars. For a long context the histogram must have fallen to at least-MinPullbackDepth; for a short context it must have risen to at least+MinPullbackDepth. This confirms a genuine momentum pause happened — the strategy is timing a dip, not chasing an extended run. - Trigger (momentum resuming): The histogram then crosses back through zero in the trend's direction on the just-closed bar. For longs, the oscillator turns from at-or-below zero to above zero; for shorts, from at-or-above zero to below zero. This cross means the double-smoothed RSI has reclaimed its signal line, which may indicate momentum resuming with the trend.
Putting the legs together, the strategy signals:
- Long: Uptrend + histogram previously dipped below zero + histogram crosses back up through zero → buy the pullback.
- Short: Downtrend + histogram previously popped above zero + histogram crosses back down through zero → sell the bounce.
Stop-loss and take-profit logic is based on the Average True Range (ATR), a volatility measure, so risk automatically scales to any symbol or timeframe:
- The stop-loss is placed
AtrMultATRs away from the entry price (below entry for longs, above for shorts). - The take-profit is set at
RewardRatiotimes the stop distance, producing a fixed reward-to-risk ratio. - Only one position per magic number is held at a time, so the ATR stop and target manage every exit — there is no separate trailing or discretionary close.
- A spread filter (
MaxSpreadPoints) skips signals when the current spread is wider than the allowed limit, helping keep simulated fills realistic.

Strategy Parameters
| Parameter | Default | Min | Max | Description |
|---|---|---|---|---|
| RsiPeriod | 14 | 7 | 28 | RSI base period feeding the oscillator chain. |
| Smooth1 | 5 | 2 | 15 | First EMA smoothing applied to the RSI. |
| Smooth2 | 3 | 2 | 10 | Second EMA smoothing (of the first) — forms the double-smoothed RSI. |
| SignalPeriod | 9 | 3 | 20 | SMA signal-line period subtracted to form the histogram. |
| TrendPeriod | 100 | 30 | 250 | Long price EMA that defines the tradable regime (trend direction). |
| PullbackLookback | 6 | 2 | 20 | The against-trend histogram dip must have occurred within this many recent bars. |
| MinPullbackDepth | 0.20 | 0.00 | 3.00 | Minimum histogram depth (in oscillator units) the pullback must reach. 0 disables the depth gate. |
| AtrPeriod | 14 | 5 | 40 | ATR period used for the stop and target distance. |
| AtrMult | 2.00 | 0.50 | 6.00 | Stop distance as a multiple of ATR. |
| RewardRatio | 1.60 | 0.50 | 5.00 | Take-profit distance as a multiple of the stop distance. |
| MaxSpreadPoints | 30 | 0 | 200 | Skip trades when the current spread (points) exceeds this value. 0 disables the filter. |
| Lots | 0.10 | 0.01 | 1.00 | Fixed trade volume in lots. |
| Magic | 5127 | 0 | 9,999,999 | Magic number that identifies this EA's positions. |
Recommended Chart Settings
The Derivative Oscillator Pullback was designed with a trending major currency pair in mind, such as EURUSD or GBPUSD, on the M15 to H1 timeframes. This suits a trend-following, swing-style approach: the market spends long stretches trending, and the strategy's edge concept is timing the pause within a trend rather than chasing the initial breakout.
Because the stop and target are ATR-based, the strategy self-scales to the volatility of whatever symbol and timeframe you apply it to. That said, results will vary considerably across different instruments and market conditions. Always test on the specific symbol, timeframe, and broker feed you intend to study before drawing any conclusions.
How to Install on MetaTrader 5
- Download the .ex5 file from the link below.
- Copy it to your MT5
MQL5\Expertsfolder. - Restart MetaTrader 5 or refresh the Navigator panel.
- Drag the EA onto a chart matching the recommended symbol and timeframe.
- Configure the input parameters and enable Algo Trading.
What to Consider Before Using This EA
Every strategy involves trade-offs. Here is a balanced view to help you study it critically.
Strengths of this approach:
- The double-smoothed Derivative Oscillator strips much of RSI's chatter, so its zero crossings are historically cleaner turn signals than raw RSI crossings.
- Trading only in the direction of a long trend EMA keeps the strategy aligned with the dominant move, which can reduce the number of low-quality counter-trend entries.
- The pullback-depth gate demands evidence of a real momentum pause, filtering out shallow, meaningless wiggles.
- ATR-based stops and targets adapt to volatility automatically, and a fixed reward-to-risk ratio enforces trade discipline.
Known limitations:
- Like all trend-following systems, this approach can struggle in range-bound or choppy markets, where the trend EMA flips frequently and pullback triggers may lead to whipsaws.
- Double smoothing reduces noise but also introduces some lag; very sharp reversals may resolve before the histogram confirms.
- The strategy holds only one position at a time and relies entirely on its fixed stop and target — it does not trail profits or exit early on weakening momentum.
- Parameter choices interact. A longer
TrendPeriodor largerMinPullbackDepthproduces fewer, more selective signals; shorter values produce more frequent but potentially noisier ones.
This strategy is best understood as an educational framework for studying momentum-based pullback timing, not as a finished system. Thorough forward testing on a demo account is essential before considering any live use.
Risk Management Tips
Sound risk management matters far more than any single indicator setting. Keep these general principles in mind as you study this strategy:
- Risk a small, fixed fraction per trade. Many educational sources suggest risking no more than 1–2% of account equity on any single position. Adjust the
Lotsparameter and your account size so the ATR-based stop keeps you within that limit. - Understand your drawdown tolerance. Even a well-designed trend strategy will have losing streaks. Study the maximum historical drawdown before committing capital, and be honest about how much equity decline you can psychologically withstand.
- Always start on a demo account. Run the EA in a risk-free simulated environment first to understand how it behaves across trending and ranging conditions before considering real funds.
- Account for spread and slippage. Use the
MaxSpreadPointsfilter and test on your actual broker's conditions, since wide spreads can meaningfully affect an ATR-scaled system. - Never over-leverage. Leverage magnifies both gains and losses. Size positions conservatively and treat capital preservation as the priority.
Risk Warning
Trading foreign exchange, CFDs, and other leveraged financial instruments involves substantial risk of loss and is not suitable for all investors. The strategies and tools discussed on this page are provided for educational purposes only and do not constitute financial advice, investment recommendations, or solicitation to trade. Always consult a qualified financial adviser before making trading decisions. Past backtest performance is not indicative of future results.
Downloads
- Expert Advisor: DerivativeOscillatorPullback.ex5 (48 downloads)
- Source Code: DerivativeOscillatorPullback.mq5 (50 downloads)
- Documentation: DerivativeOscillatorPullback.pdf (51 downloads)