Disclaimer: This article is for educational and informational purposes only. It does not constitute financial or investment advice. Trading forex and CFDs carries significant risk of loss. Past performance of any strategy – including backtests – does not guarantee future results. Never trade with money you cannot afford to lose.
What Is This Strategy?
The De Marker Pullback Continuation strategy is a trend-following system built around Tom DeMark's DeMarker oscillator, an indicator that measures the demand for higher highs versus lower lows within a chosen lookback window. The DeMarker reading always sits between 0 and 1, with 0.50 acting as a neutral midline. Most traders use DeMarker as a mean-reversion tool — buying when it sinks to an "oversold" extreme near 0.30 and selling near an "overbought" 0.70. This strategy deliberately does the opposite, using the oscillator as a pullback-and-continuation timing device inside an already established trend.
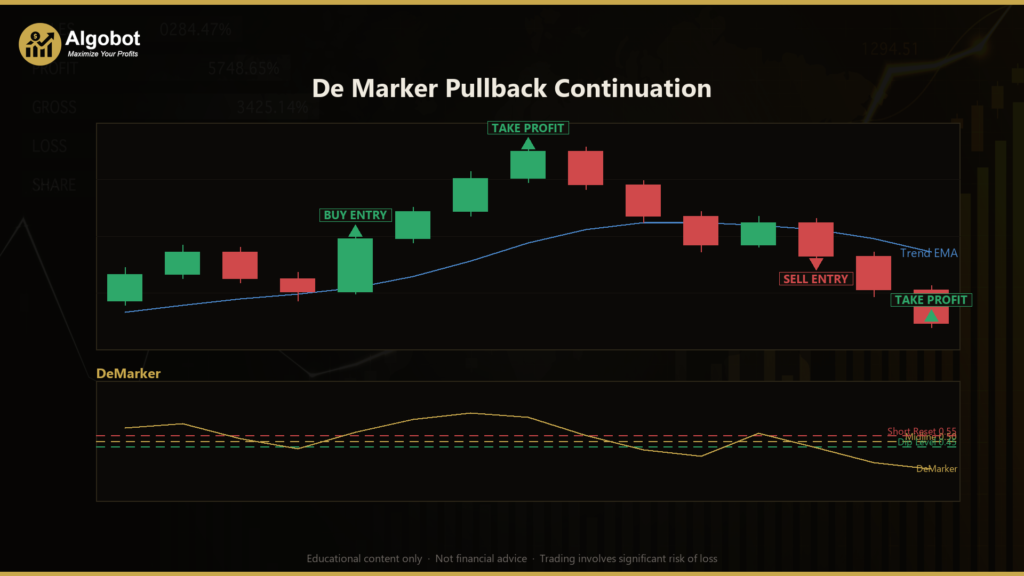
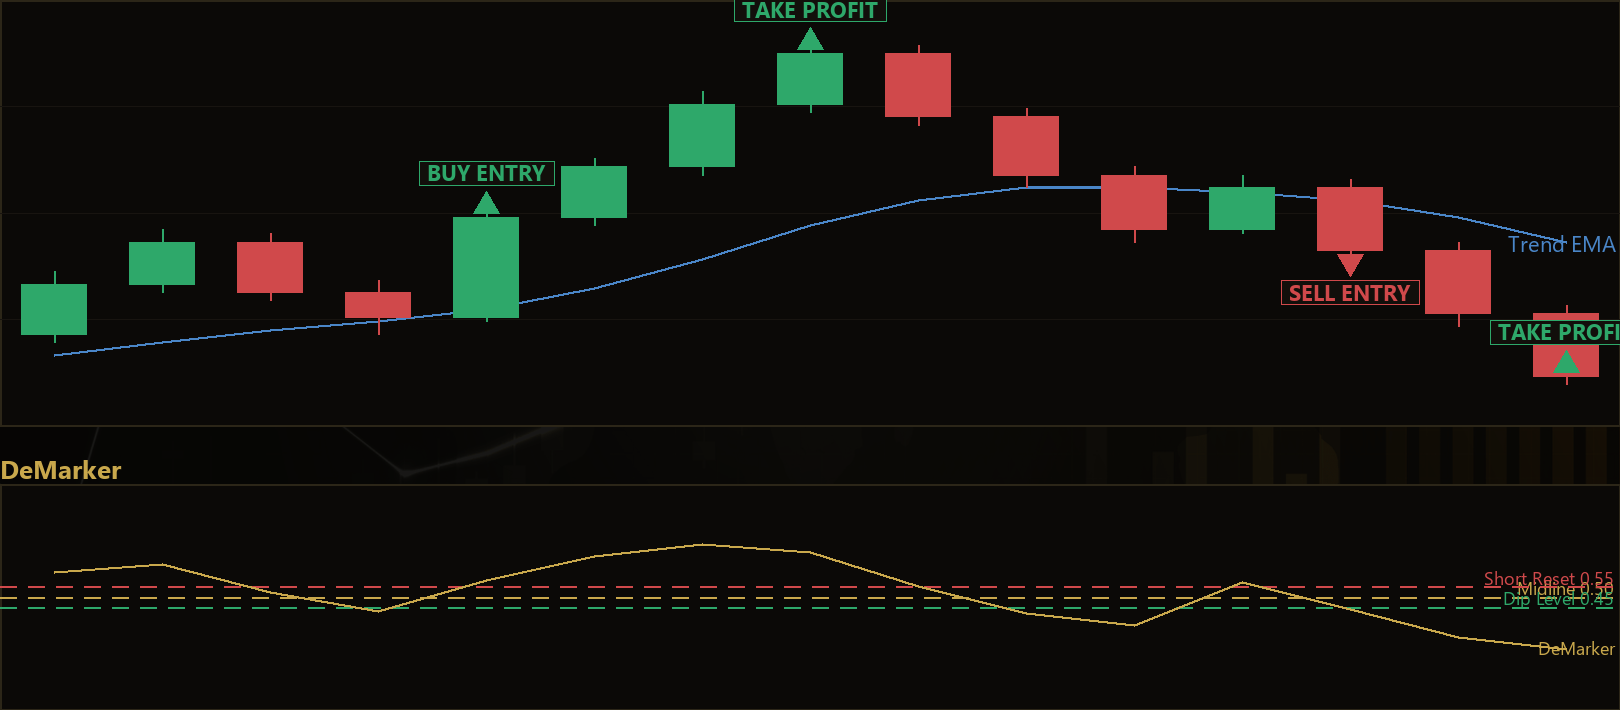
The core idea is that in a genuinely trending market, a healthy retracement rarely drags DeMarker all the way to a deep extreme. Instead, a normal pause pushes it only to a shallow "reset" level (around 0.45 in an uptrend). When buyers step back in and fresh momentum returns, DeMarker climbs back up through its 0.50 midline. That midline reclaim — occurring after a shallow reset, and only in the direction of the confirmed trend — is what the strategy treats as an entry signal. In other words, you are joining a trend on the dip rather than fighting it at an extreme.
As a learning tool, this approach suits traders who want to understand how a classic oscillator can be repurposed for trend continuation rather than reversal. It is designed for liquid, trending instruments and single-timeframe operation, and it pairs the oscillator with an EMA trend filter and structured, ATR-based risk controls. It is best viewed as a study in combining momentum, trend context, and disciplined position management — not as a shortcut to any particular outcome.
How It Works
The strategy runs on a single timeframe and evaluates its signals once per completed bar, while managing any open position on every tick. Entries follow a two-stage, stateful process: first a setup is "armed" on a shallow pullback, then it is "triggered" when momentum re-engages.
Trend context (the filter):
- An Exponential Moving Average (EMA) — a moving average that weights recent prices more heavily — defines the trend.
- Uptrend is confirmed when price closes above the EMA and the EMA is rising, measured by an ATR-normalised slope that must exceed a minimum threshold. (ATR, the Average True Range, is a volatility measure.)
- Downtrend is the mirror: price below a falling EMA with a symmetric slope gate.
- The slope gate filters out flat, choppy markets where a continuation setup has little edge.
Long entry (the two stages):
- Arm: While the trend is up, the strategy waits for DeMarker to dip to or below the shallow reset level (
DipLevel, default 0.45). The pullback is now armed. - Trigger: Within a limited number of bars (
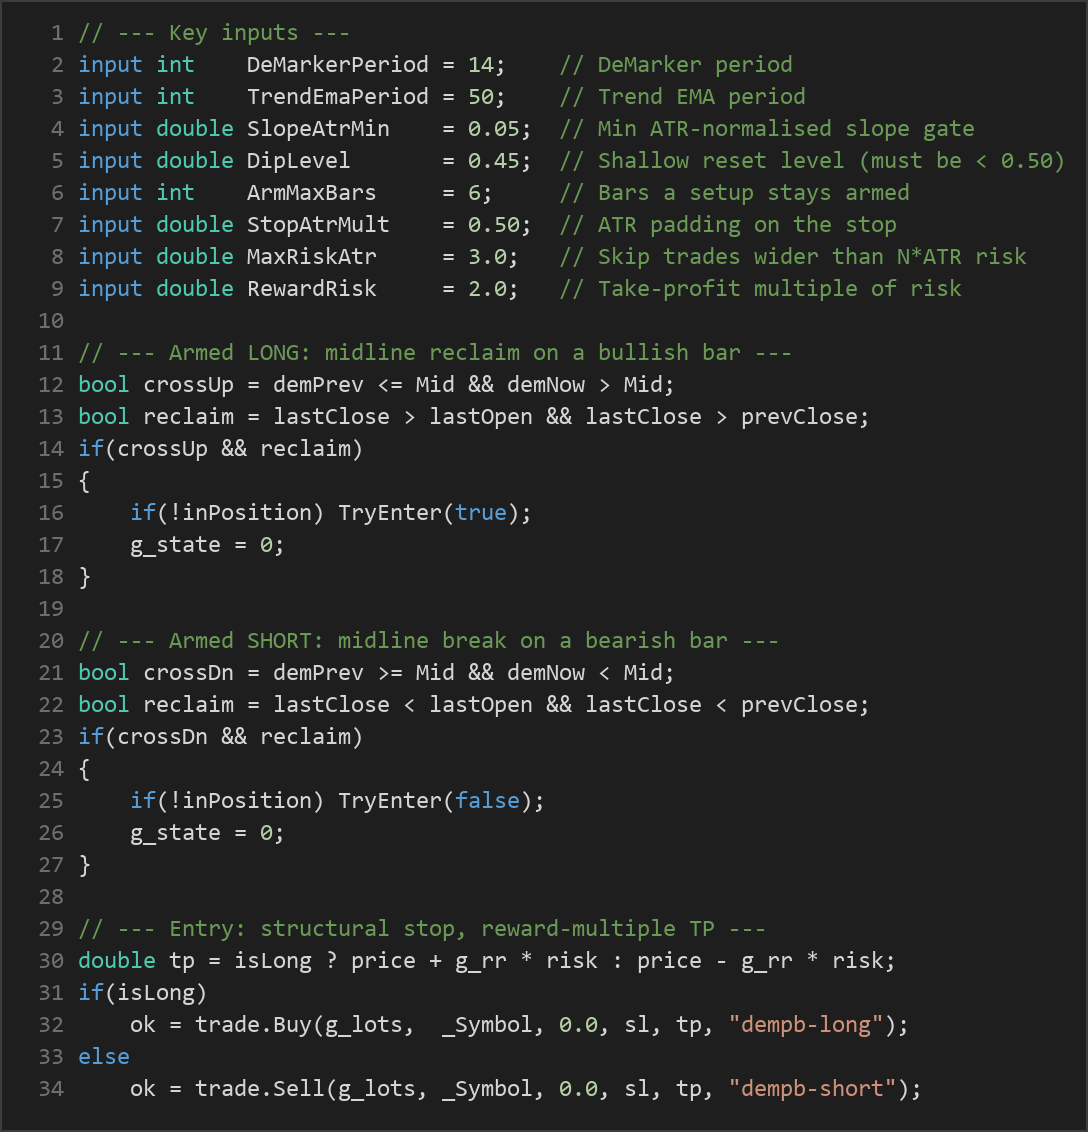
ArmMaxBars), DeMarker must cross back up through 0.50 on a bullish reclaim bar — one that closes above its own open and above the previous close. When both conditions align, the strategy signals a long entry.
Short entry is the exact opposite: in a downtrend, DeMarker must first rally to a shallow reset above 1 − DipLevel, then cross back down through 0.50 on a bearish reclaim bar.
Stop-loss logic:
- The stop is placed just beyond the recent pullback extreme (the swing low for longs, swing high for shorts, over
StopSwingBars), padded byStopAtrMult × ATR. - Because the entry sits right off the reset, this structural stop tends to be tight.
- If the resulting risk exceeds
MaxRiskAtr × ATR, the trade is skipped entirely — no single trade is allowed to risk an outsized amount.
Take-profit and trade management:
- The take-profit is set at
RewardRisk × risk(default 2× the initial risk). - Once price moves
BreakevenRrisk-multiples in your favour, the stop is pulled to break-even and then trailed byTrailAtrMult × ATR, never loosened. - Only one position is held at a time, tagged with a Magic number, with no pyramiding.
Strategy Parameters
| Parameter | Default | Min | Max | Description |
|---|---|---|---|---|
| DeMarkerPeriod | 14 | 5 | 30 | Lookback length for the DeMarker oscillator calculation. |
| TrendEmaPeriod | 50 | 20 | 200 | Period of the EMA used to define the trend direction. |
| SlopeBars | 5 | 2 | 20 | Number of bars used to measure the EMA's slope. |
| SlopeAtrMin | 0.05 | 0.0 | 0.60 | Minimum ATR-normalised EMA slope required to confirm a trend (filters flat markets). |
| DipLevel | 0.45 | 0.30 | 0.48 | Shallow "reset" level DeMarker must reach to arm a setup (must stay below the 0.50 midline). |
| ArmMaxBars | 6 | 1 | 15 | Maximum bars a setup remains armed before it is abandoned. |
| AtrPeriod | 14 | 5 | 40 | Period for the ATR used in slope normalisation, stops, and trailing. |
| StopSwingBars | 4 | 2 | 12 | Bars scanned for the swing extreme that anchors the structural stop. |
| StopAtrMult | 0.50 | 0.0 | 2.0 | ATR multiple added as padding beyond the swing extreme. |
| MaxRiskAtr | 3.0 | 1.0 | 8.0 | Trades whose risk exceeds this many ATRs are skipped. |
| RewardRisk | 2.0 | 1.0 | 5.0 | Take-profit distance expressed as a multiple of the initial risk. |
| BreakevenR | 1.0 | 0.3 | 2.0 | Profit in risk-multiples required before the stop moves to break-even and trailing begins. |
| TrailAtrMult | 1.5 | 0.5 | 4.0 | ATR trailing distance once the trade is onside. |
| Lots | 0.05 | 0.01 | 1.0 | Fixed position size in lots. |
Recommended Chart Settings
This strategy was designed with liquid, trending markets in mind — for example EURUSD or XAUUSD (gold) on the M15 to H1 timeframes. Nothing about the symbol or timeframe is hardcoded, however; every calculation uses the chart's primary timeframe, so the EA runs on whatever market and timeframe you attach it to.
The default 50-period EMA and 14-period DeMarker are general-purpose starting points. Faster timeframes will generate more setups (and more noise), while higher timeframes produce fewer but potentially cleaner signals. Keep in mind that behaviour and results will vary considerably across different instruments, spreads, and market conditions. Always test any configuration on historical data and a demo account before considering live use.
How to Install on MetaTrader 5
- Download the .ex5 file from the link below
- Copy it to your MT5
MQL5\Expertsfolder - Restart MetaTrader 5 or refresh the Navigator panel
- Drag the EA onto a chart matching the recommended symbol and timeframe
- Configure the input parameters and enable Algo Trading
What to Consider Before Using This EA
Strengths of the approach. Repurposing DeMarker for continuation rather than reversal is a thoughtful way to avoid the classic trap of fading a strong trend. The layered logic — trend filter, shallow-reset arming, midline-reclaim trigger, and a hard risk cap — means entries are quite selective. The structural stop sits close to a logical invalidation point (the pullback extreme), and the break-even-then-trail management is designed to protect capital once a move develops. Skipping any trade whose risk exceeds MaxRiskAtr × ATR is a sensible guardrail against outsized single-trade losses.
Known limitations. DeMarker, like all oscillators, is a lagging, price-derived measure; it can whipsaw when a "trend" is actually a series of short bursts. The slope gate helps, but no filter perfectly distinguishes a real trend from a range that merely looks directional in hindsight. Because the strategy only trades in the direction of the EMA trend, it will sit out ranging or transitional markets — and it may also enter late into a move that is already exhausting.
Where it may underperform. Choppy, low-volatility conditions can repeatedly arm setups that never resolve, while sharp reversals can stop out continuation entries just as the trend flips. Wide spreads or illiquid symbols will erode the tight structural stops the strategy relies on. Historically, oscillator-plus-trend systems tend to give back gains during regime changes, so the EA should be understood as one tool for one market condition — not an all-weather solution.
Risk Management Tips
Sound risk management matters more than any single indicator setting. Consider these general principles as you study the strategy:
- Risk a small, fixed fraction per trade. A common educational guideline is to risk no more than 1–2% of account equity on any single position. Adjust the
Lotsinput (and your account size) so that the strategy's structural stop reflects that percentage rather than an arbitrary lot number. - Understand drawdown. Even a well-designed system experiences losing streaks. Know how large a peak-to-trough decline you can tolerate emotionally and financially before you commit real capital.
- Start on a demo account. Run the EA in a simulated environment across different symbols and market phases first. This lets you observe how often setups arm, how they resolve, and how the trailing logic behaves — without financial consequences.
- Test across conditions. Backtest and forward-test through trending, ranging, and volatile periods so you understand the strategy's weak spots, not just its comfort zone.
- Never over-leverage. Leverage magnifies both gains and losses. Size positions conservatively and treat capital preservation as the first priority.
Risk Warning
Trading foreign exchange, CFDs, and other leveraged financial instruments involves substantial risk of loss and is not suitable for all investors. The strategies and tools discussed on this page are provided for educational purposes only and do not constitute financial advice, investment recommendations, or solicitation to trade. Always consult a qualified financial adviser before making trading decisions. Past backtest performance is not indicative of future results.
Downloads
- Expert Advisor: DeMarkerPullbackContinuation.ex5 (49 downloads)
- Source Code: DeMarkerPullbackContinuation.mq5 (49 downloads)
- Documentation: DeMarkerPullbackContinuation.pdf (69 downloads)