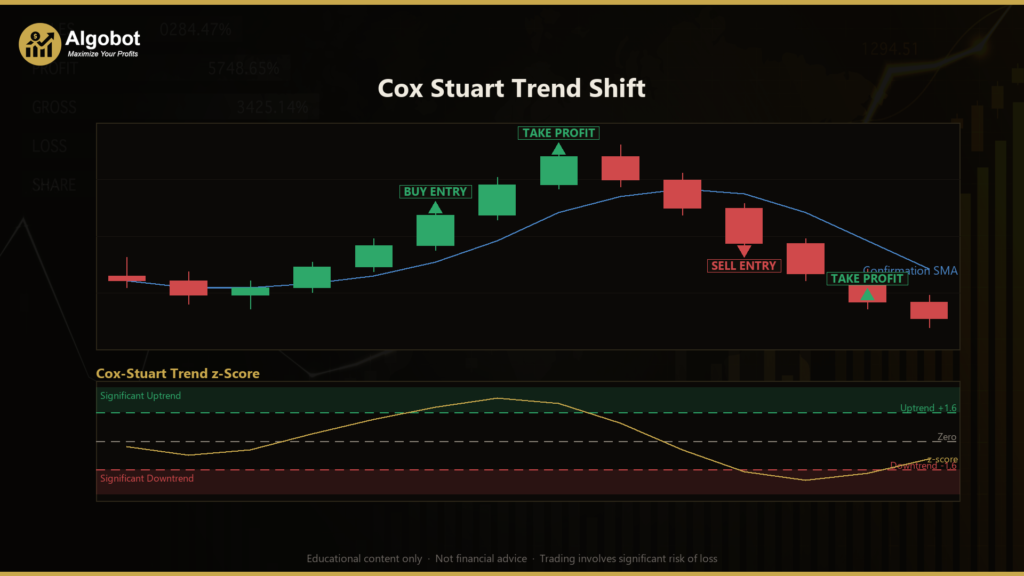
Disclaimer: This article is for educational and informational purposes only. It does not constitute financial or investment advice. Trading forex and CFDs carries significant risk of loss. Past performance of any strategy — including backtests — does not guarantee future results. Never trade with money you cannot afford to lose.
What Is This Strategy?
The Cox Stuart Trend Shift is a trend-direction strategy built on the Cox-Stuart sign test for trend, a classic distribution-free (nonparametric) statistic borrowed from the world of statistical hypothesis testing. Instead of relying on a moving average slope or a momentum oscillator, this approach asks a simple but powerful question: has the price series as a whole migrated in one direction over the recent window, or is the movement just noise? Because it is a nonparametric method, it makes no assumption that returns are normally distributed — it works purely from the signs of price changes, which makes it robust to spikes and outliers.
At its core, the strategy splits a window of recent closing prices into an "early" half and a "late" half, pairs each early close with a close a fixed distance ahead, and counts how many of those pairs moved up versus down. A strong surplus of upward pairs signals a broad, persistent uptrend; a surplus of downward pairs signals a downtrend. This count is converted into a z-score (a standardized measure of how far the result is from pure chance), giving a single signed number that summarizes trend direction and strength.
This strategy is best suited to traders and students who want to understand how statistical trend detection differs from conventional indicator-based methods. It is designed for trending market conditions and is intended as a learning tool for exploring nonparametric statistics in an automated trading context — not as a shortcut to any particular outcome. If you are curious about how hypothesis testing can be repurposed into a systematic entry filter, this is an instructive example.
How It Works
The strategy processes one completed bar at a time (it never acts on the still-forming candle, so its signals do not repaint). On each newly closed bar it recalculates three values: the Cox-Stuart z-score, a short confirmation SMA (simple moving average), and the ATR (Average True Range, a volatility measure). It then applies the following logic:
- The trend gauge: Over the last
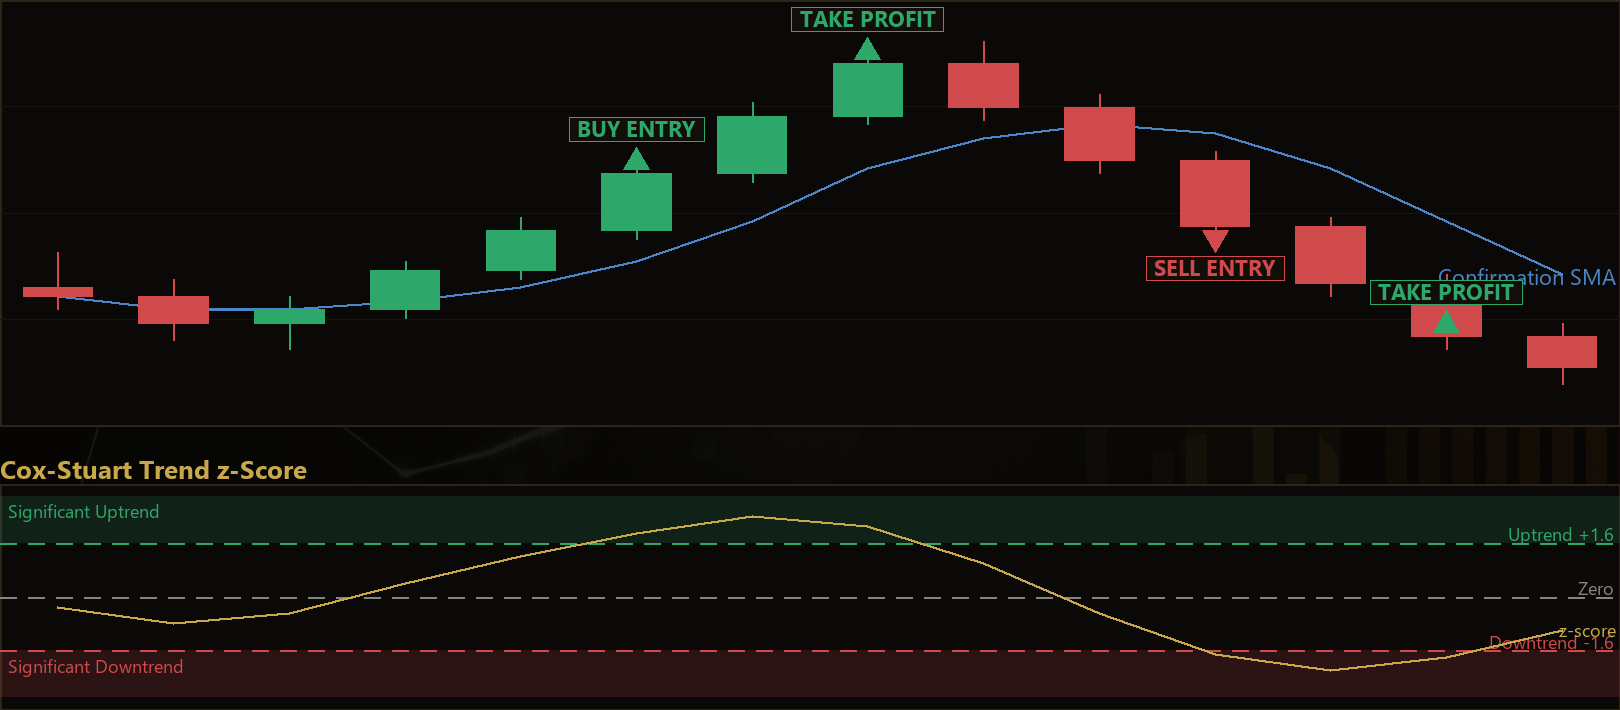
Windowcloses, the strategy pairs each early close with the closeWindow/2bars ahead. Each pair scores +1 if the later close is higher, −1 if lower, and ties are discarded. The number of up-pairs is standardized into a z-score. A large positive z indicates a statistically significant uptrend; a large negative z indicates a downtrend; a value near zero indicates no directional edge. - Long entry signal: The strategy signals a long when the z-score crosses up through the positive
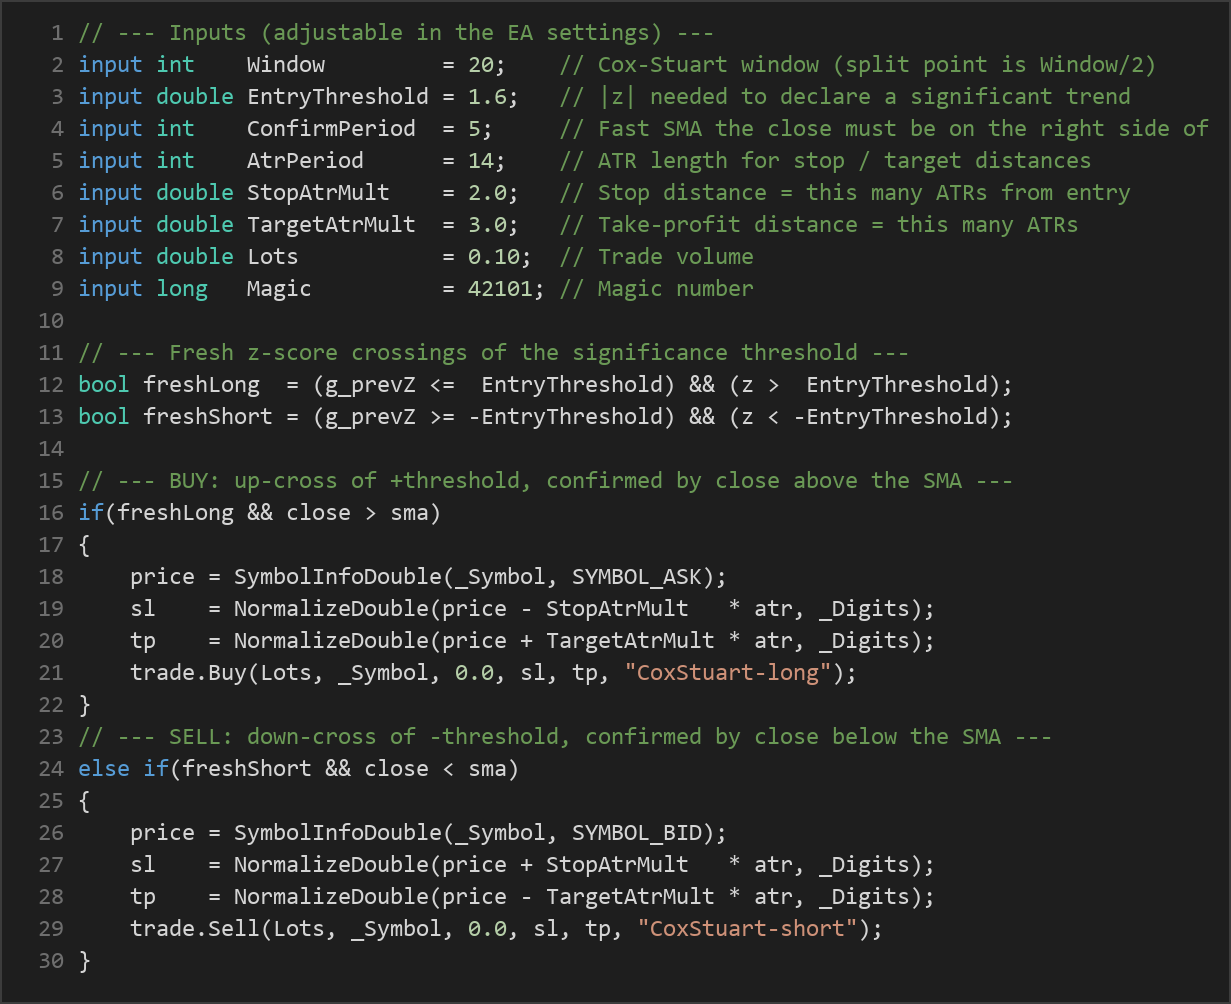
EntryThresholdand the latest close is above the confirmation SMA. The fresh crossing requirement means it only fires the moment a trend becomes statistically significant, while the SMA check helps avoid buying into an isolated spike. - Short entry signal: Symmetrically, it signals a short when the z-score crosses down through the negative
EntryThresholdand the close is below the confirmation SMA. - Position flipping: If an opposing position is already open when a new signal appears, the strategy closes it first before considering a new entry in the fresh direction.
- Trend-loss exit: The strategy exits an open trade when the statistical trend evaporates — it closes a long when the z-score drops back below zero, and closes a short when the z-score climbs back above zero. This is designed to step aside as the drift decays rather than waiting for the stop.
- Stop-loss: Every trade is protected by a hard stop placed
StopAtrMultATRs away from the entry price, so the stop distance adapts to current volatility. - Take-profit: A take-profit target is placed
TargetAtrMultATRs from entry, again scaling with volatility.
Because entries require both a fresh significance crossing and price on the correct side of the confirmation average, the strategy is deliberately selective. It aims to catch trends while they are still young and to stand down when the directional edge collapses.
Strategy Parameters
| Parameter | Default | Min | Max | Description | ||
|---|---|---|---|---|---|---|
| Window | 20 | 10 | 60 | Number of recent closes used by the Cox-Stuart test (forced even; the split point is Window/2). Larger values smooth the trend gauge and react more slowly. | ||
| EntryThreshold | 1.6 | 0.5 | 3.0 | The | z | value the test must reach to declare a statistically significant trend (~1.64 ≈ 95% one-sided confidence). Higher values demand stronger evidence. |
| ConfirmPeriod | 5 | 2 | 20 | Length of the fast confirmation SMA the close must be on the correct side of, used to filter out spikes. | ||
| AtrPeriod | 14 | 7 | 30 | Number of bars used to compute the ATR that sets stop and target distances. | ||
| StopAtrMult | 2.0 | 0.5 | 5.0 | Stop-loss distance expressed as this many ATRs from the entry price. | ||
| TargetAtrMult | 3.0 | 0.5 | 8.0 | Take-profit distance expressed as this many ATRs from the entry price. | ||
| Lots | 0.10 | 0.01 | 1.0 | Trade volume (position size) in lots. |
Recommended Chart Settings
This strategy is single-timeframe by design — every calculation reads from the chart's own timeframe, so it runs on whatever period you attach it to. That flexibility means the "best" timeframe is something you determine through testing rather than a fixed rule. A common starting point for exploring trend-following logic like this is a major forex pair such as EUR/USD on an intermediate timeframe (for example, H1 or H4), where trends tend to develop with enough persistence for the Cox-Stuart test to detect them, and where spreads are typically tight.
Keep in mind that results will vary significantly across different symbols, timeframes, and market conditions. A window and threshold that behave well on one instrument may be poorly tuned for another. Always test any configuration on historical data and a demo account before drawing conclusions, and revisit your settings as market behavior changes.
How to Install on MetaTrader 5
- Download the .ex5 file from the link below
- Copy it to your MT5
MQL5\Expertsfolder - Restart MetaTrader 5 or refresh the Navigator panel
- Drag the EA onto a chart matching the recommended symbol and timeframe
- Configure the input parameters and enable Algo Trading
What to Consider Before Using This EA
The strength of the Cox-Stuart approach lies in its nonparametric nature. Because it compares far-apart points rather than neighbouring bars, it deliberately ignores single-bar noise and only registers a signal when the whole window has shifted one way. This makes it resistant to the outliers and fat tails that can distort methods based on averages or standard deviations. Converting the result into a z-score also gives a clean, self-normalizing gauge that behaves consistently across instruments of different price scales.
There are, however, real limitations to understand. Like all trend-following logic, the strategy can struggle in ranging or choppy markets, where the z-score may oscillate around the threshold and produce entries that reverse quickly — a classic source of whipsaw losses. Its use of only the signs of price changes, while robust, also discards magnitude information, so it may be slower to react to a sharp, fast-developing move than a momentum-based tool. The trend-loss exit (z crossing back through zero) can exit trades that later resume, and the fixed ATR stop and target may not suit every volatility regime.
As with any single indicator, the Cox-Stuart test is not a complete trading system on its own. It is one lens on market behavior. Treat this EA as an educational framework for studying how statistical trend detection performs, not as a finished product to be deployed unattended with real capital.
Risk Management Tips
Sound risk management matters far more than any single entry rule. Consider these general principles as you study this strategy:
- Position sizing: Size each trade so that a stop-loss hit represents only a small fraction of your account. A widely cited guideline is to risk no more than 1–2% of your account balance per trade.
- Use a demo account first: Test the strategy thoroughly in a risk-free demo environment before ever considering live capital, so you can observe its behavior across different conditions.
- Understand drawdown: Even a well-designed strategy will endure losing streaks. Study the historical drawdown so you know what stretch of losses you might have to tolerate emotionally and financially.
- Diversify and avoid over-leverage: Concentrating risk in a single instrument or using excessive leverage can amplify losses dramatically. Keep leverage conservative.
- Keep records and review: Log your trades and periodically review whether the strategy's assumptions still hold in the current market.
Risk Warning
Trading foreign exchange, CFDs, and other leveraged financial instruments involves substantial risk of loss and is not suitable for all investors. The strategies and tools discussed on this page are provided for educational purposes only and do not constitute financial advice, investment recommendations, or solicitation to trade. Always consult a qualified financial adviser before making trading decisions. Past backtest performance is not indicative of future results.
Downloads
- Expert Advisor: CoxStuartTrendShift.ex5 (25 downloads)
- Source Code: CoxStuartTrendShift.mq5 (28 downloads)
- Documentation: CoxStuartTrendShift.pdf (31 downloads)