Disclaimer: This article is for educational and informational purposes only. It does not constitute financial or investment advice. Trading forex and CFDs carries significant risk of loss. Past performance of any strategy — including backtests — does not guarantee future results. Never trade with money you cannot afford to lose.
What Is This Strategy?
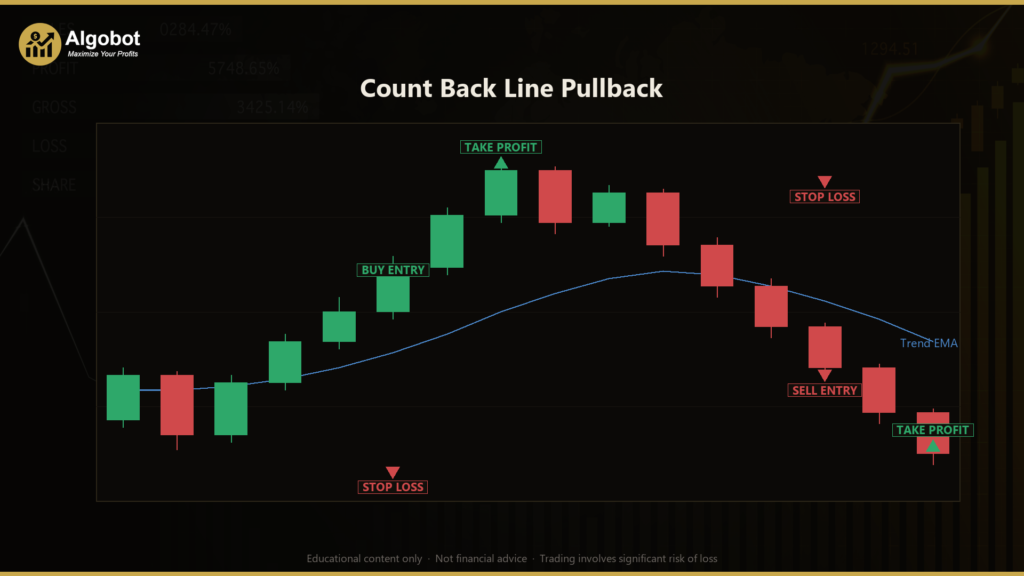
The Count Back Line Pullback strategy is an automated, trend-following pullback system built around Daryl Guppy's classic Count Back Line (CBL) — a purely structural, volatility-adaptive re-entry tool. Instead of relying on a smoothed indicator to tell you when a trend has resumed, the CBL is drawn directly from the price swing itself: it counts a fixed number of successive higher-high (or lower-low) bars away from a recent pullback extreme and uses that level as a precise re-entry trigger. This makes it a structure-based trend-continuation strategy rather than a momentum-oscillator one.
The approach is designed for markets that are already trending but have paused to pull back — the natural "breathe in" that happens inside every sustained move. When the pullback finishes and price resumes in the trend direction, the CBL provides a clean, tight, low-risk entry point. To keep the strategy from taking every minor wobble, it layers a slow Exponential Moving Average (EMA) trend filter on top: trades are only considered when the EMA is sloping in the trade direction and price sits on the correct side of it.
As a learning tool, this strategy is well suited to traders who want to understand how discretionary swing-trading concepts — pivots, higher highs, structural stops — can be encoded into rules a machine can follow objectively. It is intended for liquid instruments such as FX majors (EUR/USD, GBP/USD), metals, or indices on intraday-to-swing timeframes. Treat it as a framework for studying pullback entries and disciplined risk placement, not as a shortcut to results.
How It Works
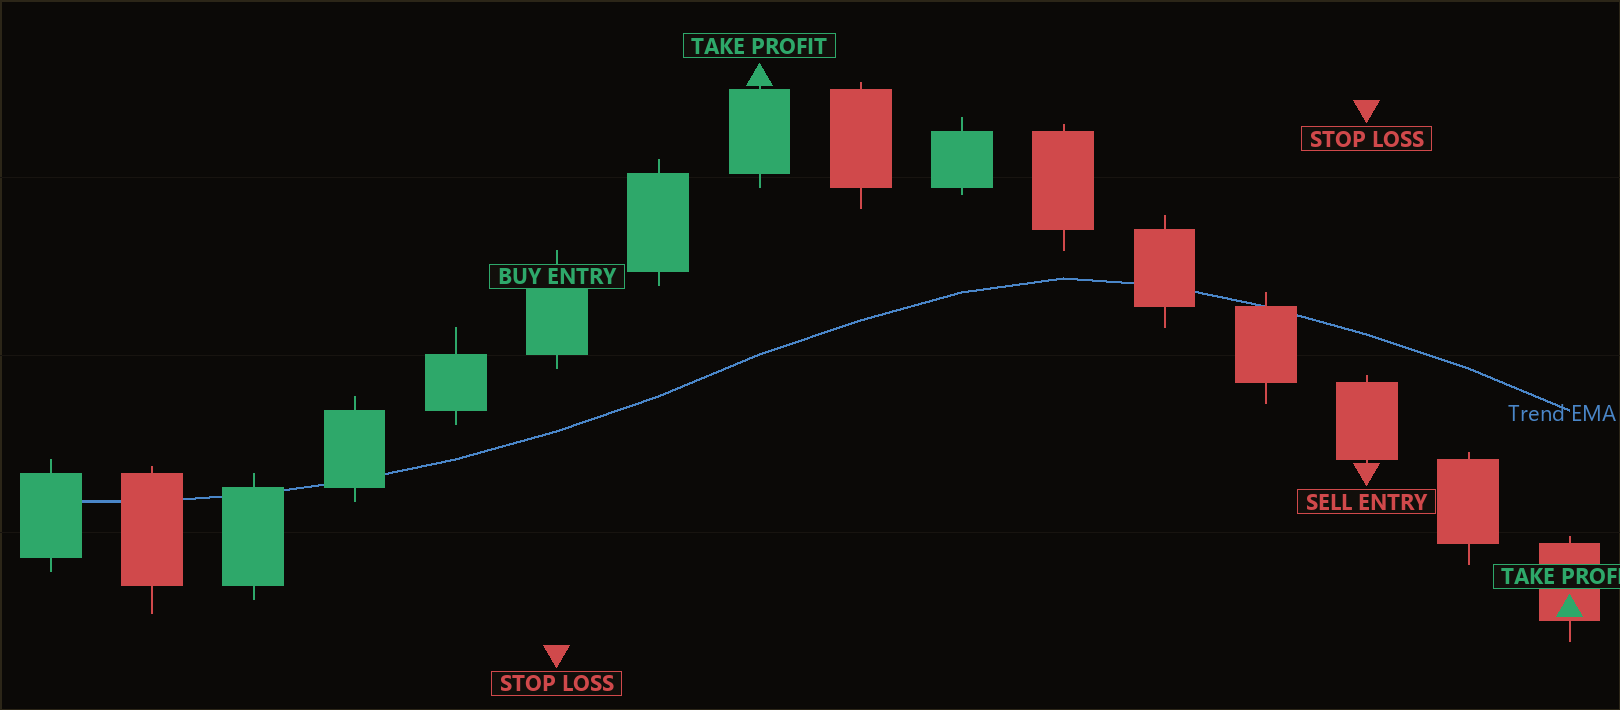
The strategy evaluates its logic once per newly closed bar (it never acts on the still-forming bar, which avoids repainting). It trades one position at a time and maintains fully distinct long and short logic. Here is the long case — the short case is a mirror image using pullback highs and lower lows.
Entry conditions (long example):
- Pivot: The strategy locates the lowest low over the last
PivotLookbackclosed bars. This low is the bottom of the pullback and becomes the structural risk anchor. - Count Back Line: Starting from the pivot bar, the logic walks forward and counts bars that each print a new higher high than the previous counted bar. The high of the
CountBars-th higher-high bar becomes the Count Back Line — the resumption trigger level. - Fresh, decisive break: The just-closed bar must close above the CBL by a margin of
BreakBufferAtr × ATR, while the previous bar was still at or below the line. Requiring the crossing bar to be the fresh one prevents chasing a move that already broke out several bars ago. - Bullish body: The trigger bar must close above its own open, confirming buying pressure on the break.
- Trend regime agreement: The slow EMA (
TrendPeriod) must be sloping up over the lastSlopeLookbackbars, and the trigger bar's close must be above the EMA. This gate keeps entries aligned with the established trend.
Stop-loss logic:
- The stop is placed just beyond the pivot low, at
pivot low − StopBufferAtr × ATR. Because the pivot is a recent pullback extreme, this stop sits close to the entry, so each trade risks a small, bounded amount by design.
Take-profit logic:
- The target is set at
entry + TpAtrMult × ATR(default 3× ATR). Paired with the tight structural stop, this creates an asymmetric reward-to-risk profile — a roomy target against a compact stop.
Trade management:
- Breakeven ratchet: Once price moves
BreakevenAtr × ATRin the trade's favour, the stop is pulled to the entry price. This runs on every tick, so a trade that has moved sufficiently in profit is protected from turning into a loss. - Trend-flip exit: If the regime EMA slope reverses against an open position, the strategy closes the trade — often well before the structural stop would be hit.
The Average True Range (ATR) — a measure of recent volatility — is used throughout to scale the break margin, the stop buffer, the target, and the breakeven distance, so every threshold adapts to current market conditions rather than using fixed pip values.
Strategy Parameters
| Parameter | Default | Min | Max | Description |
|---|---|---|---|---|
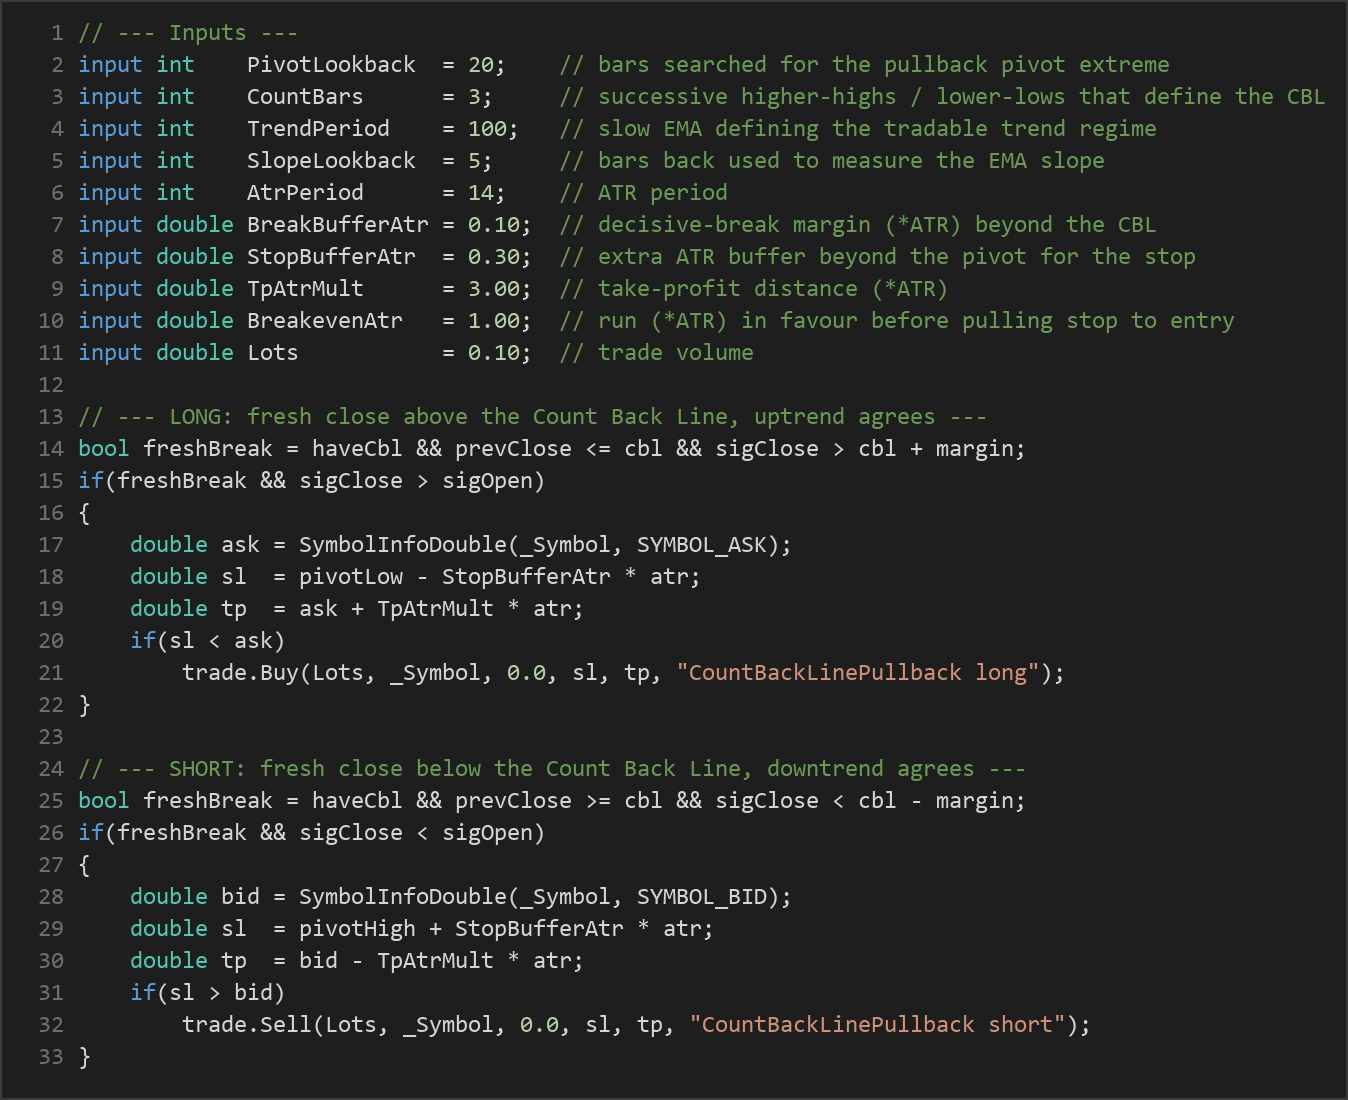
| PivotLookback | 20 | 6 | 60 | Number of closed bars searched to find the pullback pivot (the recent swing extreme). |
| CountBars | 3 | 2 | 5 | Number of successive higher-highs (long) / lower-lows (short) that define the Count Back Line. |
| TrendPeriod | 100 | 20 | 250 | Period of the slow EMA that defines the tradable trend regime. |
| SlopeLookback | 5 | 2 | 20 | Bars back used to measure the slow EMA's slope direction. |
| AtrPeriod | 14 | 7 | 28 | Period of the ATR used to scale breaks, stops, targets, and breakeven. |
| BreakBufferAtr | 0.10 | 0.00 | 1.00 | Decisive-break margin: the crossing close must clear the CBL by this × ATR. |
| StopBufferAtr | 0.30 | 0.00 | 1.50 | Extra ATR buffer placed beyond the pivot for the structural stop. |
| TpAtrMult | 3.00 | 0.50 | 8.00 | Take-profit distance as a multiple of ATR. |
| BreakevenAtr | 1.00 | 0.00 | 3.00 | Move (× ATR) in favour before the stop is pulled to entry. |
| Lots | 0.10 | 0.01 | 1.00 | Trade volume in lots. |
| Magic | 7314 | 0 | 9,999,999 | Magic number used to identify this EA's positions. |
Recommended Chart Settings
The Count Back Line Pullback EA is designed to run on a single primary timeframe — whatever timeframe you attach it to. It reads all its bars from the chart's own period, so there is no hidden multi-timeframe dependency. It is best suited to liquid FX majors such as EUR/USD or GBP/USD, and also works conceptually on metals or indices, on timeframes ranging from M15 to H4.
Because the strategy depends on clean, sustained trends with orderly pullbacks, its behaviour will vary considerably across different market conditions. A pair that is ranging or whipsawing will produce very different results than one in a steady trend. Always test any symbol and timeframe combination thoroughly before considering live use.
How to Install on MetaTrader 5
- Download the .ex5 file from the link below
- Copy it to your MT5
MQL5\Expertsfolder - Restart MetaTrader 5 or refresh the Navigator panel
- Drag the EA onto a chart matching the recommended symbol and timeframe
- Configure the input parameters and enable Algo Trading
What to Consider Before Using This EA
Strengths of this approach. The Count Back Line is a genuinely elegant idea: it derives its trigger from the actual swing structure rather than from a lagging indicator, so entries tend to be tight and the accompanying stop is naturally close. The fresh-cross requirement discourages chasing, and the EMA trend gate keeps the system aligned with the dominant direction. The breakeven ratchet and trend-flip exit are sensible protections that aim to keep individual losses small and bounded.
Known limitations. No structural pullback method escapes the fundamental weakness of trend-following: it needs a trend. In choppy, sideways, or news-driven markets, the EMA slope can flip back and forth, generating entries that are stopped out or exited quickly. The tight structural stop that makes winners efficient can also mean a slightly wider pullback than expected takes the trade out just before the move continues. The CountBars and PivotLookback settings materially change how "deep" a pullback must be before a signal appears — too tight and you catch noise, too loose and you enter late.
Where it may underperform. Expect weaker behaviour during low-volatility consolidations, during high-impact news spikes that blow through structural levels, and on illiquid or heavily spread instruments where the ATR-scaled buffers may not reflect true execution costs. This strategy is a study in disciplined pullback entries — it is not a solution for every market regime.
Risk Management Tips
- Size positions responsibly. As a general principle, many educational sources suggest risking no more than 1–2% of account equity per trade. The
Lotsparameter is fixed volume, so calculate what that lot size actually risks given the structural stop distance before deploying. - Always start on a demo account. Run the EA in a demo environment across varied conditions to understand its behaviour, trade frequency, and drawdown profile before risking real capital.
- Understand drawdown. Even a strategy with small individual losses can experience losing streaks. Study the maximum consecutive losses and equity dips in testing so you are mentally and financially prepared.
- Respect the trend filter's role. The EMA gate is what keeps this strategy out of unsuitable markets. Loosening it too far can expose you to the very ranging conditions the design tries to avoid.
- Never trade money you cannot afford to lose, and consider consulting a qualified financial adviser about whether leveraged trading suits your circumstances.
Risk Warning
Trading foreign exchange, CFDs, and other leveraged financial instruments involves substantial risk of loss and is not suitable for all investors. The strategies and tools discussed on this page are provided for educational purposes only and do not constitute financial advice, investment recommendations, or solicitation to trade. Always consult a qualified financial adviser before making trading decisions. Past backtest performance is not indicative of future results.
Downloads
- Expert Advisor: CountBackLinePullback.ex5 (32 downloads)
- Source Code: CountBackLinePullback.mq5 (37 downloads)
- Documentation: CountBackLinePullback.pdf (54 downloads)