Disclaimer: This article is for educational and informational purposes only. It does not constitute financial or investment advice. Trading forex and CFDs carries significant risk of loss. Past performance of any strategy — including backtests — does not guarantee future results. Never trade with money you cannot afford to lose.
What Is This Strategy?
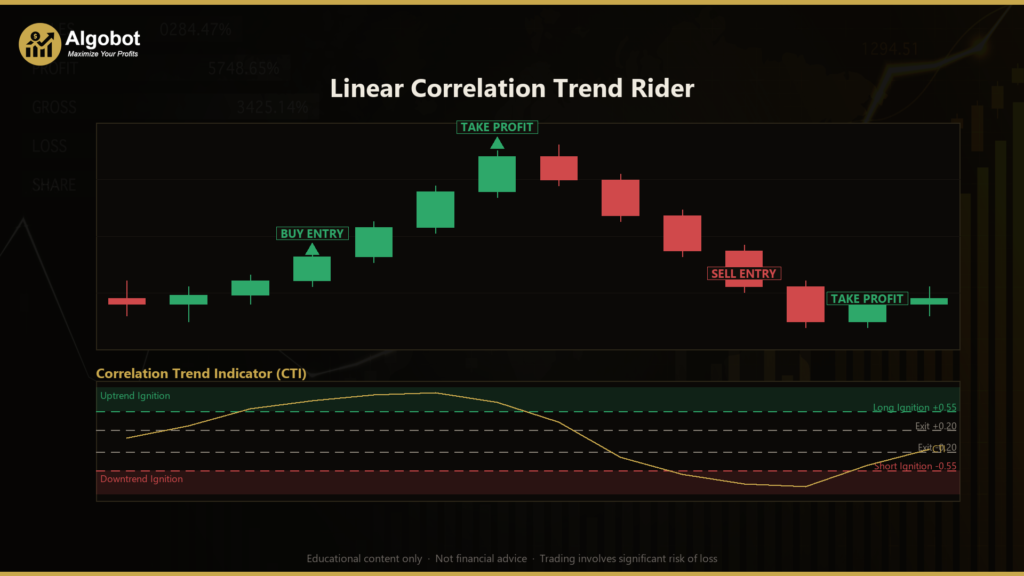
The Linear Correlation Trend Rider is a trend-following expert advisor for MetaTrader 5 built around Ehlers' Correlation Trend Indicator (CTI), a momentum tool that measures how straight and directional recent price action has been. Instead of comparing two market series, the CTI calculates the Pearson correlation — a statistic that ranges from -1 to +1 and describes how closely two data sets move together — between the last several closing prices and a simple rising time ramp (the numbers 0, 1, 2, and so on). In plain terms, it asks: "Have prices been marching up or down in a nearly straight line over time?"
Because the reading is bounded between -1 and +1 and is self-normalizing, the same threshold values behave consistently across different symbols, timeframes, and volatility conditions. A CTI near +1 describes a clean, mature uptrend; a reading near -1 describes a clean downtrend; and a value near 0 signals chop, ranging, or a market that is turning. This makes the indicator an intuitive lens for studying trend quality rather than just trend direction.
This strategy is designed for trending market conditions and is best suited as a learning tool for traders who want to understand how a correlation-based filter can time the ignition of a trend — the moment a directional move tightens into a genuine line. It is an educational study of momentum engagement and disciplined exits, not a shortcut to results. Anyone exploring how statistical indicators translate into concrete entry and exit rules will find it a clear, self-contained example.
How It Works
The strategy acts once per newly closed bar, using the just-closed candle rather than the still-forming one. On each closed bar it recalculates the CTI over the chosen window and compares it to the prior bar's value to detect a fresh change in trend structure. Here is how the logic breaks down.
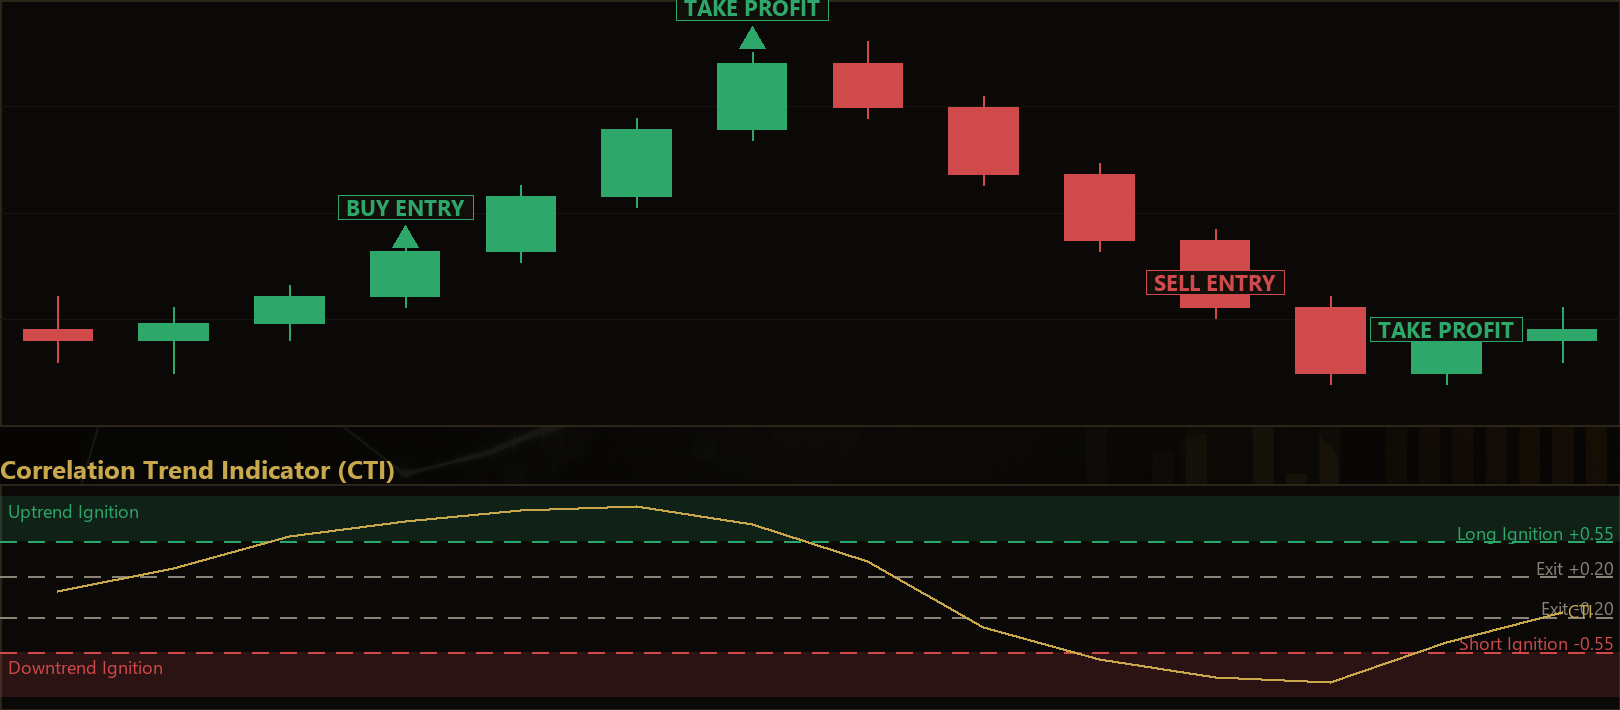
Long entry ("ignition") — the strategy signals a buy when all of the following align:
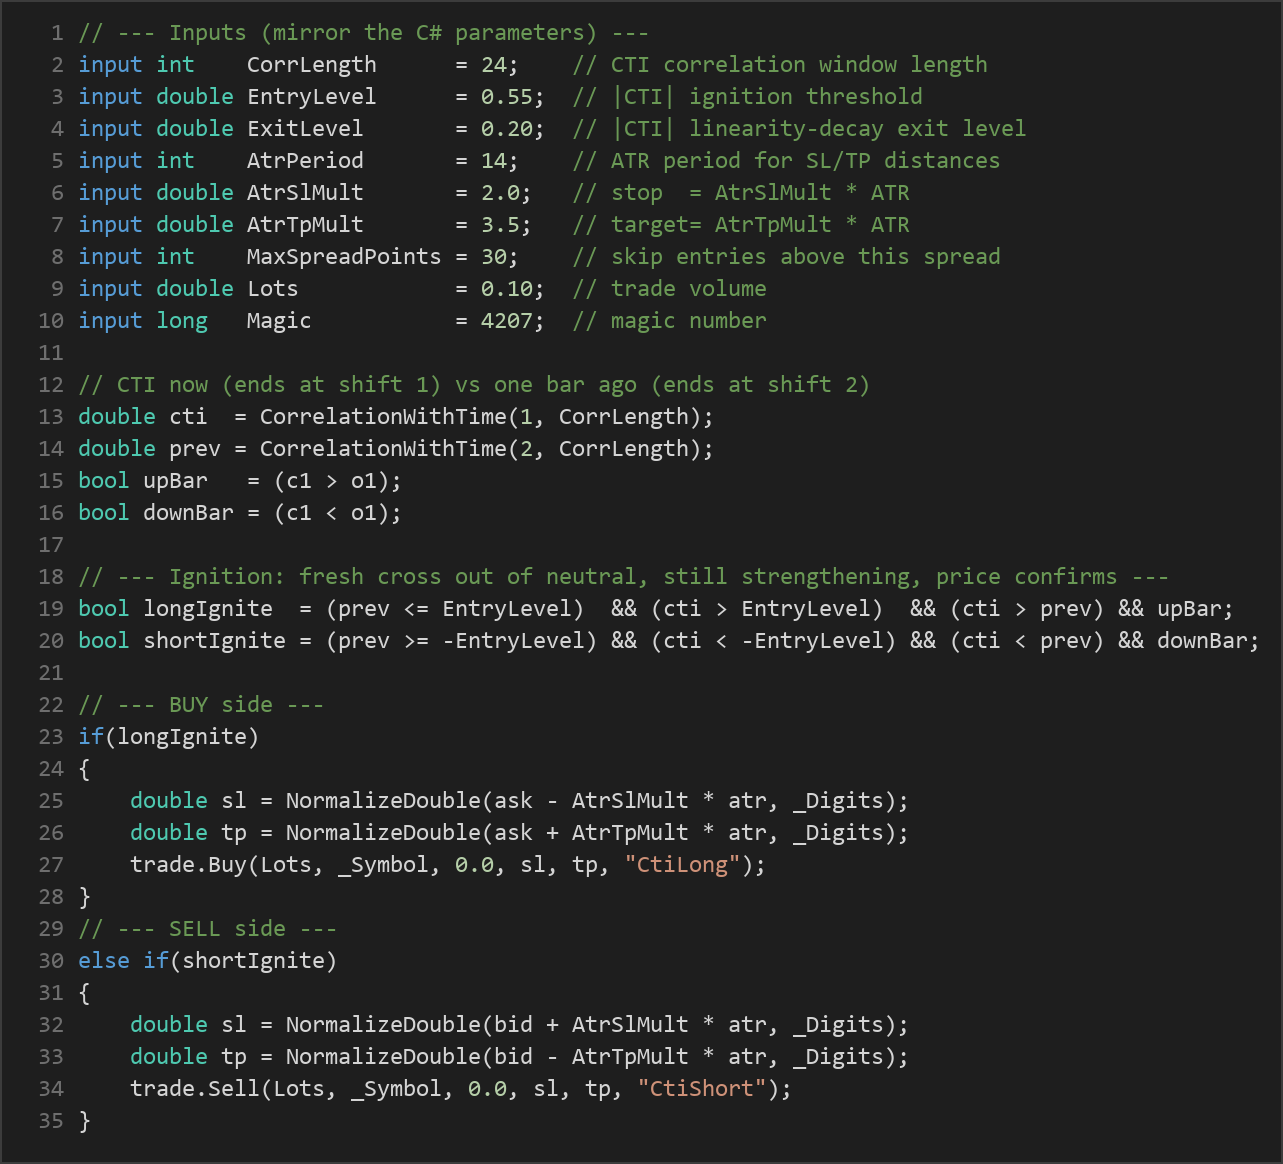
- The CTI has just crossed out of the neutral zone above the positive entry threshold — it was at or below the level one bar ago and is now above it (a fresh cross, not an old signal).
- The correlation is still strengthening — the current CTI is higher than the previous bar's, meaning the uptrend is tightening into a line rather than rolling over.
- The just-closed candle is an up bar (close above open), tying the statistical read to real candle geometry.
Short entry — the mirror image:
- The CTI has just crossed below the negative entry threshold, having been at or above it one bar earlier.
- The correlation is still building on the downside (current CTI lower than the previous bar).
- The just-closed candle is a down bar (close below open).
Exit — a linearity-decay rule:
- When the absolute CTI value falls back below the exit level, the straight-line structure is considered broken down — a stall, a turn, or churn. The strategy closes the open position even if neither the stop-loss nor take-profit has been reached.
- Because both legs are symmetric, a fresh opposite ignition can close one side and open the other on the same bar.
Stop-loss and take-profit — volatility-based:
- Both distances are derived from the Average True Range (ATR), an indicator that measures typical price movement per bar.
- The stop-loss is placed at the entry price minus (for longs) or plus (for shorts)
AtrSlMult × ATR. - The take-profit is placed at
AtrTpMult × ATRaway from entry in the trade direction. - Anchoring the risk to ATR lets the stop and target breathe with current volatility instead of using fixed pip distances.
Additional controls: A spread filter skips new entries when the current spread is wider than the allowed maximum, keeping simulated fills realistic. The strategy holds a single position per magic number and works on one primary timeframe throughout.
Strategy Parameters
| Parameter | Default | Min | Max | Description |
|---|---|---|---|---|
| CorrLength | 24 | 8 | 80 | Number of closing prices in the CTI correlation window. Longer values smooth the reading and respond to slower trends; shorter values react faster but are noisier. |
| EntryLevel | 0.55 | 0.30 | 0.90 | The absolute CTI threshold that must be freshly crossed to arm a trade. Higher values demand a cleaner, more established straight-line trend before entry. |
| ExitLevel | 0.20 | -0.20 | 0.60 | The absolute CTI level at which the trend is judged to have decayed, closing the position. Lower values give the trade more room; higher values exit sooner. |
| AtrPeriod | 14 | 5 | 40 | Lookback period for the ATR used to size the stop-loss and take-profit distances. |
| AtrSlMult | 2.0 | 0.5 | 6.0 | Stop-loss distance as a multiple of ATR. Larger multiples set a wider stop. |
| AtrTpMult | 3.5 | 0.5 | 10.0 | Take-profit distance as a multiple of ATR. Together with the stop multiple this defines the reward-to-risk shape. |
| MaxSpreadPoints | 30 | 0 | 200 | Maximum allowed spread (in points) for a new entry; set to 0 to disable the filter. |
| Lots | 0.10 | 0.01 | 1.0 | Fixed trade volume in lots for each position. |
Recommended Chart Settings
The Linear Correlation Trend Rider is symbol- and timeframe-agnostic by design — because the CTI is bounded and self-normalizing, its thresholds behave consistently across instruments. That said, correlation-based trend indicators tend to be studied most cleanly on liquid major forex pairs (such as EUR/USD or GBP/USD) on intraday-to-swing timeframes like H1 or H4, where trends have room to develop into recognizable straight lines and spreads stay tight.
The default correlation window of 24 bars pairs naturally with these higher timeframes. As always, results will vary considerably across different symbols, sessions, and market conditions, so treat any single chart configuration as a starting point for your own testing rather than a fixed recommendation.
How to Install on MetaTrader 5
- Download the .ex5 file from the link below
- Copy it to your MT5
MQL5\Expertsfolder - Restart MetaTrader 5 or refresh the Navigator panel
- Drag the EA onto a chart matching the recommended symbol and timeframe
- Configure the input parameters and enable Algo Trading
What to Consider Before Using This EA
Strengths of the approach. The CTI is an elegant, bounded statistic that reads trend quality in a single number, so the same thresholds transfer across markets without rescaling. The "ignition" logic — requiring a fresh cross and a strengthening correlation and a confirming candle — is deliberately selective, which helps filter out weak or fading signals. The linearity-decay exit is a thoughtful design choice: it releases a position when the trend structure breaks down, rather than waiting passively for a stop.
Known limitations. Like all trend-following systems, this strategy is built for directional markets and will historically struggle in choppy, sideways conditions, where fresh crosses can appear and quickly fail. Because the CTI correlates price against time, sharp but brief spikes may register as clean trends that do not persist. The exit rule can close a healthy position early during a temporary pullback that dips the correlation below the exit level. And with a single fixed lot size and no trailing stop, the risk profile is static — it does not adapt to account growth or lock in open profit as a trade develops.
Where it may underperform. Expect weaker behavior during range-bound sessions, around major news releases that produce erratic candles, and on very low timeframes where noise dominates and spreads eat into ATR-scaled targets. No indicator anticipates reversals, and the CTI is no exception — it describes what price has done, not what it will do next.
Risk Management Tips
Sound risk management matters more than any single indicator setting. Consider these general principles as you study this strategy:
- Risk a small, fixed fraction per trade. A common educational guideline is to risk no more than 1–2% of account equity on any single position. Adjust the lot size so your ATR-based stop distance stays within that limit rather than trading a fixed volume blindly.
- Test on a demo account first. Run the EA on a demo or paper account long enough to observe how it behaves across trending and ranging conditions before considering any live capital.
- Understand drawdown. Every strategy experiences losing streaks. Review the maximum peak-to-trough decline in your testing so you know what a normal rough patch looks like and can stay disciplined through it.
- Size positions to survive. Leverage magnifies both directions. Choose a position size that keeps you comfortably in the game through a string of losses, not one calibrated to the best case.
- Keep expectations grounded. Backtest and demo results are a study aid, not a forecast. Markets change, and a configuration that looked strong historically may behave differently going forward.
Risk Warning
Trading foreign exchange, CFDs, and other leveraged financial instruments involves substantial risk of loss and is not suitable for all investors. The strategies and tools discussed on this page are provided for educational purposes only and do not constitute financial advice, investment recommendations, or solicitation to trade. Always consult a qualified financial adviser before making trading decisions. Past backtest performance is not indicative of future results.
Downloads
- Expert Advisor: LinearCorrelationTrendRider.ex5 (47 downloads)
- Source Code: LinearCorrelationTrendRider.mq5 (41 downloads)
- Documentation: LinearCorrelationTrendRider.pdf (35 downloads)