Disclaimer: This article is for educational and informational purposes only. It does not constitute financial or investment advice. Trading forex and CFDs carries significant risk of loss. Past performance of any strategy — including backtests — does not guarantee future results. Never trade with money you cannot afford to lose.
What Is This Strategy?
Coppock Curve Momentum is a momentum and trend-following strategy built around the Coppock Curve, a smoothed momentum oscillator originally created by economist Edwin Coppock. The Coppock Curve is calculated as a weighted moving average (WMA) — an average that gives the most recent data the greatest importance — applied to the sum of two Rate-of-Change (ROC) readings. Rate of Change simply measures how much price has moved, as a percentage, over a defined number of bars. By layering two ROC lookbacks and then smoothing them with a WMA, the indicator produces a slow-moving line that rises and falls with the broader momentum of the market.
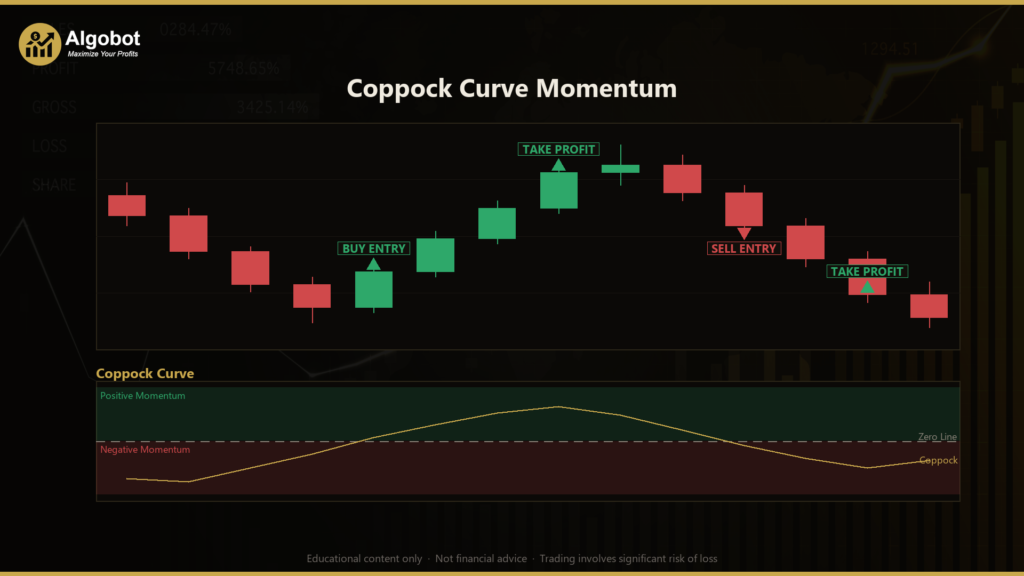
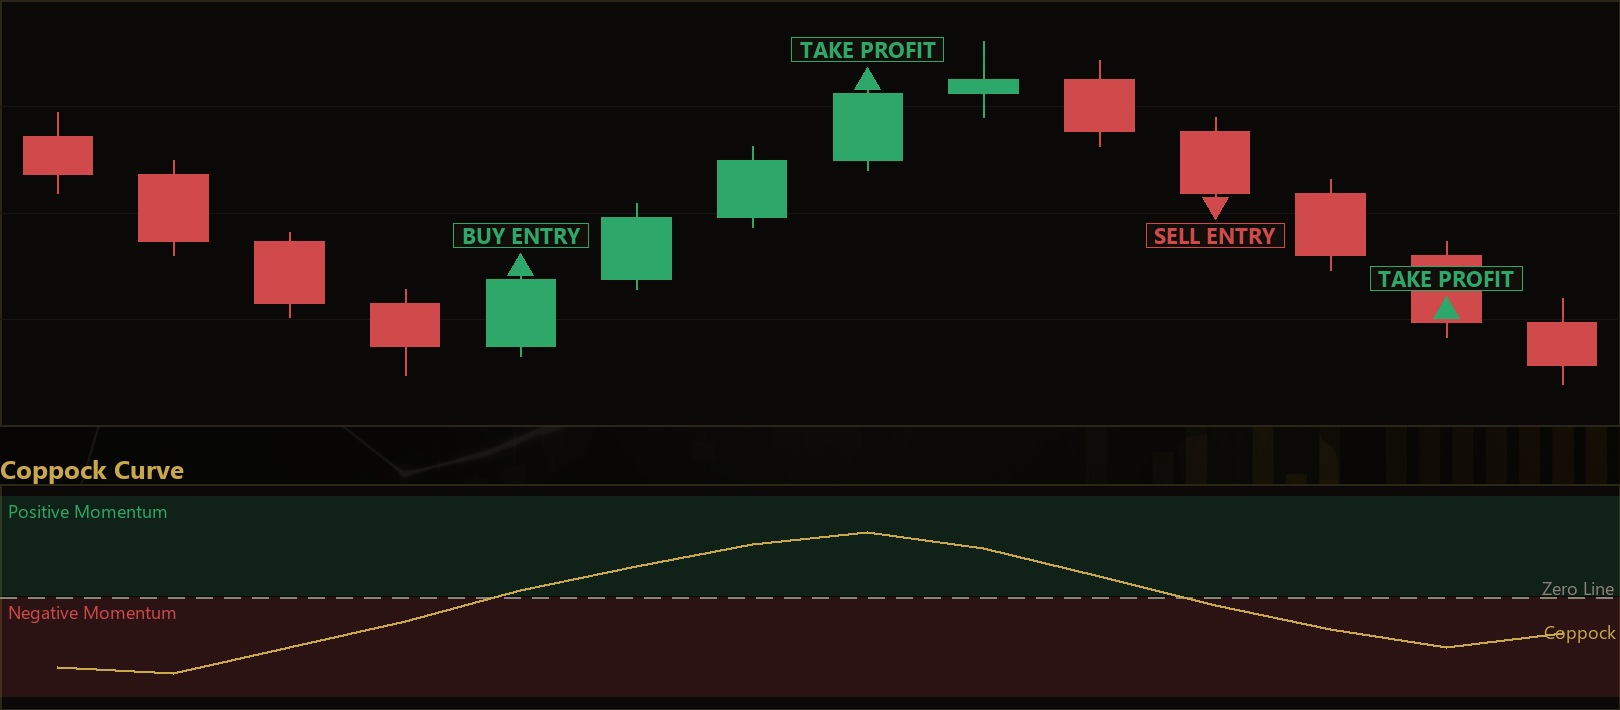
Historically, the Coppock Curve was used as a long-only, bottom-picking tool on monthly stock indices. This strategy takes a different, symmetric approach: it treats the oscillator as a two-sided momentum engine. When the curve crosses above its zero line, momentum has turned positive and the strategy signals a long bias. When the curve crosses below zero, momentum has turned negative and it signals a short bias. Because the indicator is triple-smoothed (two ROCs plus a WMA), the crossovers are designed to fire on genuine shifts in momentum regime rather than on short-term noise.
This strategy is best understood as a learning tool for traders who want to study how momentum oscillators can define directional bias and how objective, rule-based entries and exits behave in an automated Expert Advisor (EA). It is designed for liquid instruments and is timeframe-agnostic, making it a useful sandbox for exploring momentum concepts rather than a shortcut to any particular outcome.
How It Works
The strategy evaluates its logic once per completed bar, so signals are based on closed data rather than a still-forming candle. Here is how the rules come together in plain English:
- Building the indicator: For each completed bar, the strategy computes two Rate-of-Change values — one using the long lookback and one using the short lookback — and adds them together. It then applies a weighted moving average across the most recent ROC sums to produce the current Coppock Curve value.
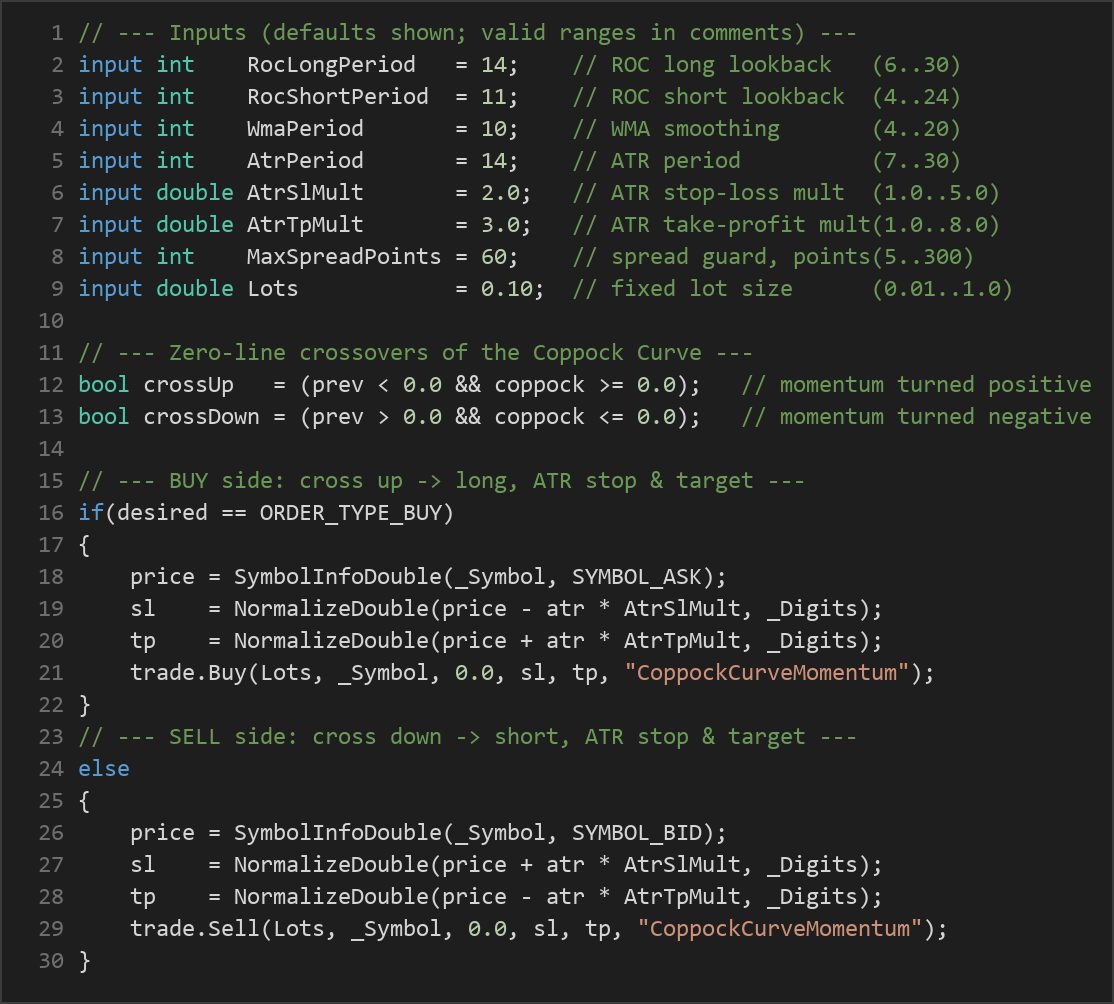
- Long entry signal: When the Coppock Curve was below zero on the prior reading and moves to zero or above on the current reading (a zero-line cross up), the strategy signals a long (buy) bias.
- Short entry signal: When the Coppock Curve was above zero on the prior reading and moves to zero or below on the current reading (a zero-line cross down), the strategy signals a short (sell) bias.
- Always-in reversal logic: The strategy holds only one position at a time. On a fresh opposite signal, it closes any existing position and opens a new one in the new direction. If a signal matches a position already open, it does nothing and lets that trade continue.
- Spread guard: Before any entry, the strategy checks the current spread. If the spread is wider than the configured maximum (in points), the entry is skipped. This helps avoid trading when execution cost is abnormally high.
- Stop-loss logic: Stops are volatility-based, using the Average True Range (ATR) — a measure of how much price typically moves per bar. For a long trade, the stop is placed below the entry price by ATR multiplied by the stop-loss multiplier; for a short trade, it is placed above by the same distance.
- Take-profit logic: The take-profit is also ATR-based. For a long trade it sits above entry by ATR multiplied by the take-profit multiplier; for a short trade it sits below by the same distance. Because the default take-profit multiplier is larger than the stop multiplier, each trade is structured with a reward target wider than its initial risk.
- Exit conditions: A position may close in one of three ways — the ATR stop-loss is hit, the ATR take-profit is reached, or an opposite Coppock Curve crossover triggers a reversal.
Strategy Parameters
| Parameter | Default | Min | Max | Description |
|---|---|---|---|---|
| RocLongPeriod | 14 | 6 | 30 | Lookback (in bars) for the longer Rate-of-Change reading used in the Coppock sum. |
| RocShortPeriod | 11 | 4 | 24 | Lookback (in bars) for the shorter Rate-of-Change reading used in the Coppock sum. |
| WmaPeriod | 10 | 4 | 20 | Number of ROC-sum values smoothed by the weighted moving average to form the Coppock Curve. |
| AtrPeriod | 14 | 7 | 30 | Number of bars used to calculate the Average True Range for stop and target distances. |
| AtrSlMult | 2.0 | 1.0 | 5.0 | Multiplier applied to ATR to set the stop-loss distance from entry. |
| AtrTpMult | 3.0 | 1.0 | 8.0 | Multiplier applied to ATR to set the take-profit distance from entry. |
| MaxSpreadPoints | 60 | 5 | 300 | Maximum allowable spread (in points) for an entry; wider spreads skip the trade. |
| Lots | 0.10 | 0.01 | 1.0 | Fixed position size, in lots, used for every trade. |
Recommended Chart Settings
Coppock Curve Momentum is timeframe-agnostic by design — it runs on whatever primary timeframe your chart or backtest selects, and it is intended for any liquid instrument such as a major FX pair, a metal, or an index. Because the Coppock Curve is a slow, heavily smoothed oscillator, higher timeframes (for example H1, H4, or daily) tend to produce fewer and more deliberate crossover signals, while lower timeframes will generate more frequent signals with more noise.
There is no single "correct" symbol or timeframe. The best practice is to test the strategy across several instruments and timeframes to understand how its behavior changes. Keep in mind that results will vary considerably across different market conditions, and a configuration that suited one environment may behave very differently in another.
How to Install on MetaTrader 5
- Download the .ex5 file from the link below
- Copy it to your MT5
MQL5\Expertsfolder - Restart MetaTrader 5 or refresh the Navigator panel
- Drag the EA onto a chart matching the recommended symbol and timeframe
- Configure the input parameters and enable Algo Trading
What to Consider Before Using This EA
Like any single-indicator system, Coppock Curve Momentum has both strengths and clear limitations worth understanding before you rely on it.
Strengths. The triple-layer smoothing (two ROCs plus a WMA) is designed to filter out much of the market noise that causes faster oscillators to whipsaw. In sustained, trending conditions, a zero-line crossover strategy like this one may capture the middle of a momentum move and stay aligned with the dominant direction thanks to its always-in reversal logic. The rules are fully objective, the position size is fixed, and the spread guard adds a layer of execution discipline.
Limitations. The same smoothing that reduces noise also introduces lag — the Coppock Curve reacts slowly, so signals often arrive well after a turn has begun. In choppy, sideways, or range-bound markets, the oscillator can hover near the zero line and produce repeated crossovers, leading to a series of small losing reversals ("whipsaws"). Because the strategy is always-in on a fresh flip, it will take a position on every qualifying signal regardless of the broader context, which can be costly when momentum is unclear.
Where it may underperform. Expect the weakest behavior during low-volatility consolidation, during news-driven spikes that reverse quickly, and on instruments or sessions where spreads widen frequently. The fixed lot size also means risk is not scaled to account equity or to the current ATR-based stop distance, so the monetary risk per trade can vary from trade to trade. Treat this EA as a framework for studying momentum crossovers, not as a finished, drop-in system.
Risk Management Tips
Sound risk management matters far more than any single indicator setting. Consider these general principles as you study the strategy:
- Risk a small, fixed fraction per trade. Many educational sources suggest risking no more than 1–2% of account equity on any single position, so that a losing streak does not threaten your capital.
- Size positions deliberately. Because this EA uses a fixed lot size, review whether that size is appropriate for your account and for the ATR-based stop distance on each instrument you test.
- Always start on a demo account. Run the strategy in a risk-free simulated environment first to understand its signal frequency, drawdown behavior, and how it reacts to different market conditions before considering any live use.
- Understand drawdown. Every strategy experiences losing periods. Study the depth and duration of drawdowns in testing so your expectations are realistic and you can stay disciplined.
- Account for costs. Spreads, commissions, and slippage all affect real-world outcomes. The built-in spread guard helps, but you should still factor total trading costs into any evaluation.
- Keep a trading journal. Recording your tests and observations helps you learn what the strategy does well and where it struggles.
Risk Warning
Trading foreign exchange, CFDs, and other leveraged financial instruments involves substantial risk of loss and is not suitable for all investors. The strategies and tools discussed on this page are provided for educational purposes only and do not constitute financial advice, investment recommendations, or solicitation to trade. Always consult a qualified financial adviser before making trading decisions. Past backtest performance is not indicative of future results.
Downloads
- Expert Advisor: CoppockCurveMomentum.ex5 (55 downloads)
- Source Code: CoppockCurveMomentum.mq5 (57 downloads)
- Documentation: CoppockCurveMomentum.pdf (62 downloads)