Disclaimer: This article is for educational and informational purposes only. It does not constitute financial or investment advice. Trading forex and CFDs carries significant risk of loss. Past performance of any strategy — including backtests — does not guarantee future results. Never trade with money you cannot afford to lose.
What Is This Strategy?
Control Chart Reversion is a mean-reversion trading strategy that borrows a tool from factory quality control — the Shewhart control chart — and applies it to price action on MetaTrader 5. In manufacturing, engineers use control charts to tell the difference between random, expected variation and a genuine shift in a process. This Expert Advisor (EA) uses that same statistical idea to decide when a price move is simply noise that should snap back, and when it is a real trend that should be left alone.
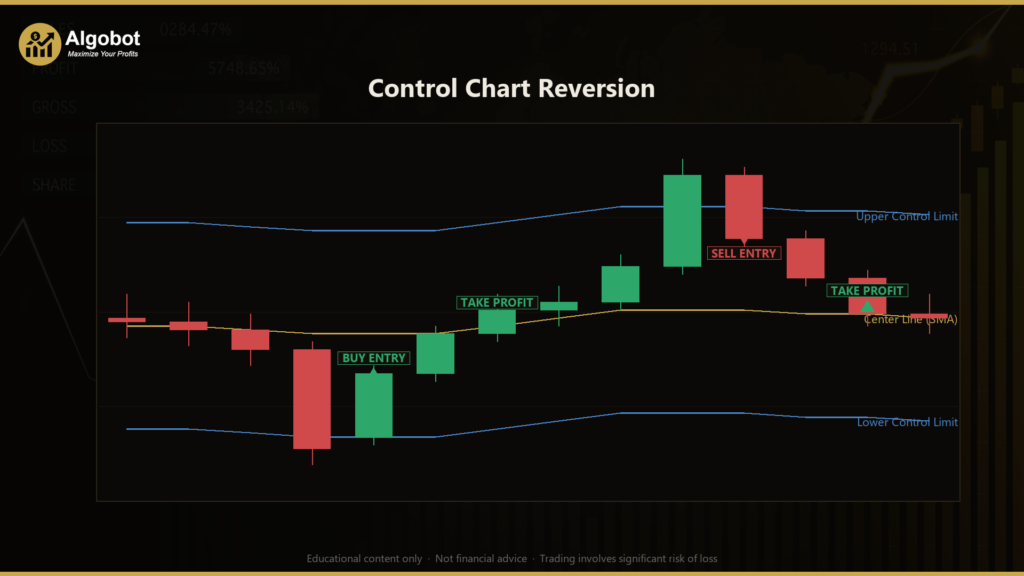
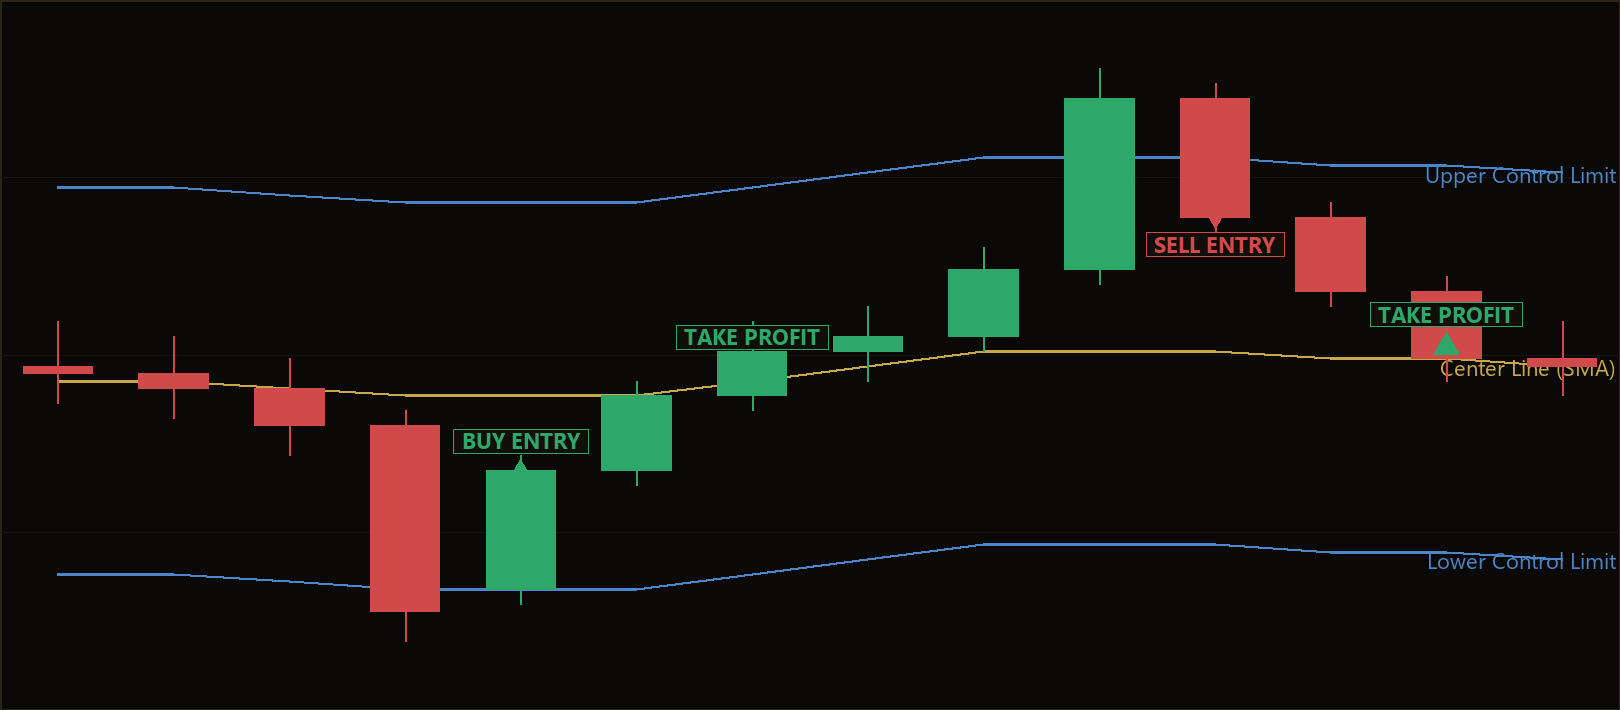
The strategy builds a rolling center line (a simple moving average of recent closing prices) and then draws control limits a set number of standard deviations above and below it. A standard deviation is a measure of how spread out prices have been; two or three standard deviations from the average is statistically unusual. When a single bar closes beyond one of those limits and then closes back inside on the following bar, the strategy treats that excursion as a temporary anomaly and fades it — trading in the opposite direction, back toward the center line.
Control Chart Reversion is designed as a learning tool for traders who want to understand how statistical process control (SPC) concepts translate to markets. It suits range-bound or balanced conditions on liquid instruments, and it is best studied by those curious about disciplined, rules-based mean reversion rather than anyone seeking a shortcut. Think of it as a case study in turning a well-established engineering technique into a transparent, back-testable trading model.
How It Works
The strategy acts once per closed bar and evaluates two classic control-chart signals — an outlier rule and a run rule — before considering any trade. Here is the logic in plain English:
- Build the control chart. For the most recent Period closing prices, the strategy calculates the average (the center line, or CL) and the population standard deviation. It then places an upper control limit at CL + EntrySigma standard deviations and a lower control limit at CL − EntrySigma standard deviations.
- Detect an outlier (Shewhart Rule 1). If a closed bar pushes beyond a control limit, that is a statistical anomaly in a ranging market. The strategy interprets it as noise that is likely to revert toward the center line, rather than as new, meaningful information.
- Check the run rule (Nelson Rule 2). The strategy counts how many consecutive closes have finished on the same side of the center line. If that count reaches TrendRunLength, it treats the move as a genuine shift in the process mean — in other words, a real trend. When a trend is confirmed on one side, the counter-trend fade on that side is suppressed so the system does not fight a confirmed trend. This is the primary drawdown-control mechanism.
- Wait for the reclaim, not the knife. Rather than entering on the outlier bar itself (which could be the start of a larger move), the strategy waits one bar. It only acts if the next bar closes back inside the control band, signaling that reversion has actually begun.
The entry rules follow directly from these signals:
- Long setup: A prior bar closes below the lower control limit, the next bar closes back inside it, and there is no confirmed down-trend. The strategy signals a BUY.
- Short setup: A prior bar closes above the upper control limit, the next bar closes back inside it, and there is no confirmed up-trend. The strategy signals a SELL.
Stop-loss logic is structural and volatility-aware. For a long, the stop is placed just below the lowest low of the two-bar excursion, offset by StopAtrMult multiplied by the Average True Range (ATR) — a common measure of recent volatility. For a short, the stop sits above the excursion high by the same buffer. This keeps the stop just beyond the point that would invalidate the reversion idea.
Take-profit logic targets the center line itself. Because the trade is a bet that price reverts to its recent average, the CL is a short-distance, high-probability objective. The strategy also enforces a MinTargetAtr filter: if the distance to the center line is smaller than that minimum multiple of ATR, the trade is skipped as not worth the risk. Only one position per magic number is held at a time, and the stop-loss and take-profit manage the exit.
Strategy Parameters
| Parameter | Default | Min | Max | Description |
|---|---|---|---|---|
| Period | 20 | 10 | 60 | Number of closed bars used for the center line (moving average) and standard deviation. |
| EntrySigma | 2.5 | 1.5 | 3.5 | Distance of the control limits from the center line, measured in standard deviations. |
| TrendRunLength | 7 | 5 | 12 | Consecutive closes on one side of the center line that confirm a trend and suppress the counter-fade. |
| AtrPeriod | 14 | 7 | 28 | Lookback period for the ATR used to size the structural stop buffer. |
| StopAtrMult | 1.2 | 0.5 | 3.0 | Multiplier applied to ATR to set the stop distance beyond the excursion extreme. |
| MinTargetAtr | 0.5 | 0.1 | 3.0 | Minimum take-profit distance to the center line, in multiples of ATR, required to take a trade. |
| Lots | 0.10 | 0.01 | 1.0 | Fixed lot size for each position. |

Recommended Chart Settings
Control Chart Reversion was designed with liquid FX majors such as EUR/USD in mind, on intraday timeframes where ranging behavior is common between larger swings. Because every calculation reads from the chart's primary timeframe, you can attach the EA to whatever timeframe you select at test time — but intraday charts (for example M15, M30, or H1) fit its short-distance, revert-to-the-mean design most naturally.
As with any statistical model, results will vary across different symbols, timeframes, and market conditions. Trending or thin, volatile instruments will behave very differently from a balanced major pair. Always test any configuration on historical data and a demo account before drawing conclusions.
How to Install on MetaTrader 5
- Download the .ex5 file from the link below
- Copy it to your MT5
MQL5\Expertsfolder - Restart MetaTrader 5 or refresh the Navigator panel
- Drag the EA onto a chart matching the recommended symbol and timeframe
- Configure the input parameters and enable Algo Trading
What to Consider Before Using This EA
Strengths. The appeal of Control Chart Reversion is its transparency and discipline. It is built on a well-documented statistical framework, so every decision can be explained: an outlier beyond a control limit, a reclaim back inside, and a trend filter that steps aside when the data says the mean has shifted. The reclaim requirement helps avoid entering directly into a strong move, and targeting the center line keeps objectives short and grounded in the recent average rather than in hope.
Known limitations. Mean reversion, by its nature, tends to perform best in ranging or balanced conditions and struggles when markets trend persistently. The Nelson Rule 2 run filter is designed to reduce that risk by suppressing counter-trend fades once a trend is confirmed, but no filter is perfect — a mean shift can occur before TrendRunLength closes accumulate, and the strategy may still fade the early stage of a genuine breakout. Standard-deviation limits also assume a reasonably stable distribution of returns; during volatility spikes, news events, or gaps, price can travel far beyond the control band and hit the structural stop.
Where it may underperform. Expect weaker behavior in strongly trending markets, during major news releases, in illiquid instruments with wide spreads, and around session opens where volatility clusters. Because the strategy holds only one position at a time and relies on fixed lots, it does not compound or diversify on its own. Treat it as a study of one specific idea — SPC applied to price — rather than a complete trading system.
Risk Management Tips
- Size positions responsibly. A widely taught guideline is to risk no more than 1–2% of account equity on any single trade. Adjust the lot size and stop distance so that a losing trade stays within that limit for your account.
- Start on a demo account. Test the strategy in a risk-free demo environment first to understand how it behaves across different market conditions before considering any live use.
- Understand drawdown. Even a well-designed mean-reversion approach will experience strings of losing trades. Study the historical drawdown so you know what a normal losing streak looks like and can decide whether you could tolerate it.
- Respect volatility. ATR-based stops adapt to conditions, but you should still be aware of scheduled news and low-liquidity periods when spreads widen and slippage increases.
- Never over-leverage. Leverage amplifies both gains and losses. Keep total exposure modest and never trade with money you cannot afford to lose.
Risk Warning
Trading foreign exchange, CFDs, and other leveraged financial instruments involves substantial risk of loss and is not suitable for all investors. The strategies and tools discussed on this page are provided for educational purposes only and do not constitute financial advice, investment recommendations, or solicitation to trade. Always consult a qualified financial adviser before making trading decisions. Past backtest performance is not indicative of future results.
Downloads
- Expert Advisor: ControlChartReversion.ex5 (45 downloads)
- Source Code: ControlChartReversion.mq5 (46 downloads)
- Documentation: ControlChartReversion.pdf (49 downloads)