
Disclaimer: This article is for educational and informational purposes only. It does not constitute financial or investment advice. Trading forex and CFDs carries significant risk of loss. Past performance of any strategy — including backtests — does not guarantee future results. Never trade with money you cannot afford to lose.
What Is This Strategy?
The Commitment Ratio Pullback is a with-trend pullback-continuation strategy for MetaTrader 5 that combines a custom order-flow filter called the Commitment Ratio (CR) with a classic dual Exponential Moving Average (EMA) trend framework and an RSI timing gate. An EMA is a moving average that weights recent prices more heavily, so it reacts faster than a simple average; RSI (Relative Strength Index) is a momentum oscillator that moves between 0 and 100 and measures whether price has been pushed up or down too quickly. The strategy blends these familiar tools with one original idea to decide when a trend is committed enough to be worth following.
The core concept is simple but insightful. Every candle travels a total range from its high to its low, but only part of that travel is genuinely "committed" — the body, measured as the distance between the open and the close. The rest is "rejected" wick, where price probed a level and was pushed back. The Commitment Ratio sums the absolute bodies and divides by the summed ranges over a lookback window, producing a number between 0 and 1. A market being pushed with conviction prints large bodies and small wicks, so CR is high. A choppy, indecisive market prints small bodies and long two-sided wicks, so CR is low. In this way, CR acts as a regime filter that tells you when order flow is committed, independent of moving-average lag.
This makes the strategy a useful learning tool for traders who want to understand how candle anatomy can be turned into a quantitative filter, and how a trend-following system can demand conviction before it acts. It is designed for liquid, trending markets rather than range-bound conditions, and it is best studied by intermediate learners who already grasp EMAs, RSI, and the Average True Range (ATR), a common measure of volatility. As always, treat this as a study in strategy construction, not as a shortcut to returns.
How It Works
The strategy only evaluates signals when a bar closes, and it keeps at most one position open per magic number so that exposure stays bounded. Here is how the logic flows:
- Regime gate (the Commitment Ratio): Over the last
CommitWindowclosed bars, the strategy sums the absolute candle bodies and divides by the summed candle ranges. The resulting Commitment Ratio must be greater than or equal toCommitThreshold. If CR is too low, the market is considered choppy and no trade is taken. - Directional bias (NetBody): The signed sum of bodies (
Close − Open) over the same window is called NetBody. A positive NetBody means recent commitment was upward; negative means downward. Trades require this to agree with the EMA relationship — a double directional confirmation. - Trend direction: For a long, the fast EMA (
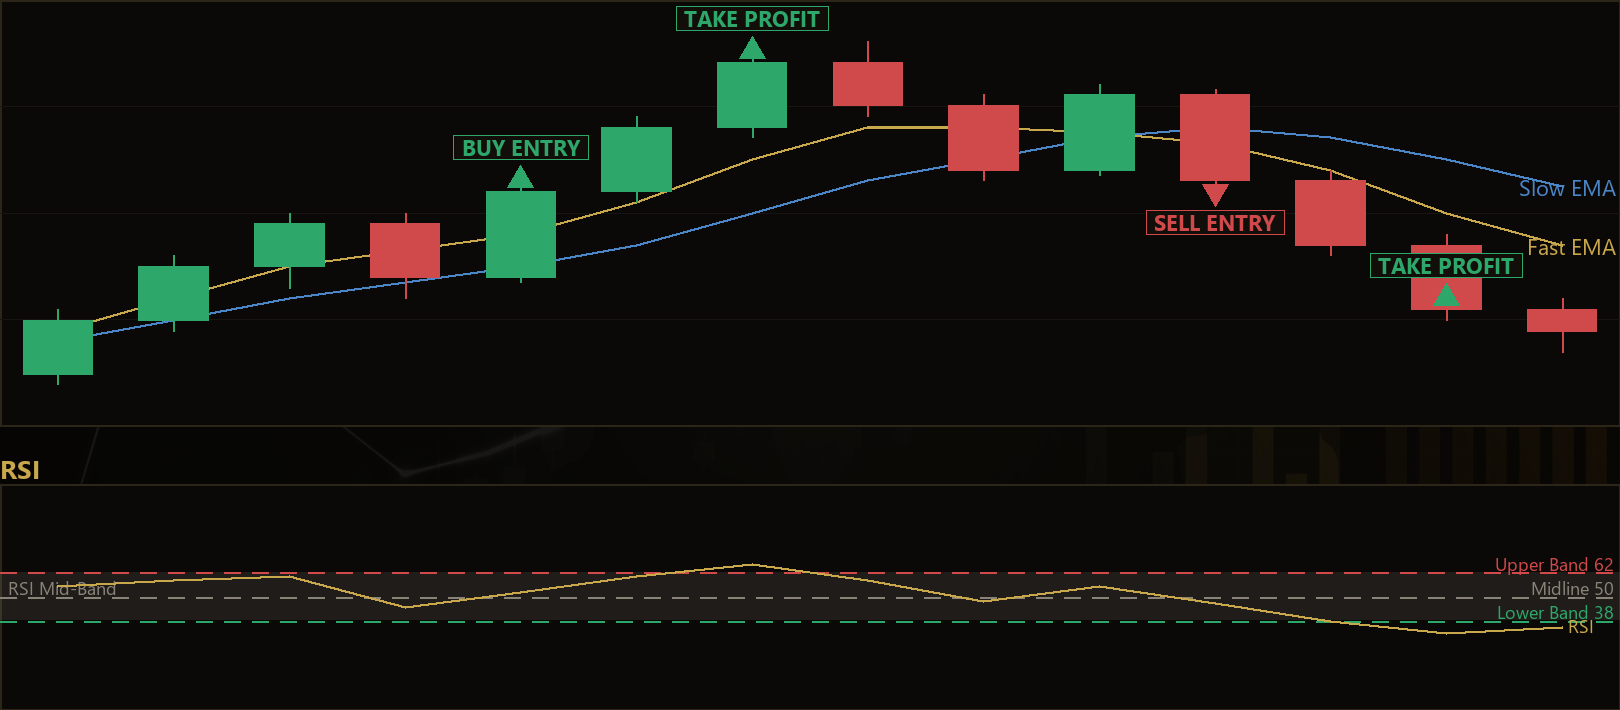
FastEma) must be above the slow EMA (SlowEma) and NetBody must be positive. For a short, the fast EMA must be below the slow EMA and NetBody must be negative. - Pullback and reclaim (the entry trigger): For a long, the prior bar must have closed below the fast EMA — a shallow dip toward the mean — and the just-closed trigger bar must have closed back above the fast EMA with an up body (close above open). This is a fresh reclaim cross from below. The short setup is the exact mirror: a bounce above the fast EMA, then a rejection back below with a down body.
- Timing gate (RSI mid-band): RSI must sit inside a band around 50, defined by
RsiHalfBand. The idea is that momentum cooled during the dip but never reached an exhaustion extreme, so the strategy signals buying the continuation rather than the blow-off top. - Spread gate: If the current spread in points exceeds
MaxSpreadPoints, the signal is skipped to avoid trading in poor conditions.
For risk management, the logic is structural and volatility-buffered so it can adapt to any symbol or timeframe:
- Stop-loss: Placed just beyond the swing extreme of the last
PullbackLookbackbars, buffered byStopAtrBuffermultiplied by ATR. For a long, that is the recent swing low minus the buffer; for a short, the recent swing high plus the buffer. - Take-profit: Set at a
RewardRiskmultiple of the measured stop distance, giving an asymmetric payoff structure. - Break-even lock: Once price travels
BreakevenAtr× ATR in your favour, the stop is pulled to the entry price to protect against a reversal. - Trend-flip exit: If the fast/slow EMA relationship flips against an open trade, the position is closed immediately, which is designed to cut losers early and keep drawdown tight.
Strategy Parameters
| Parameter | Default | Min | Max | Description |
|---|---|---|---|---|
| FastEma | 20 | 8 | 40 | Period of the fast EMA baseline that the pullback must reclaim. |
| SlowEma | 50 | 30 | 120 | Period of the slow EMA that defines overall trend direction. |
| CommitWindow | 14 | 6 | 40 | Number of bars used to measure how committed (body vs. wick) recent travel has been. |
| CommitThreshold | 0.55 | 0.35 | 0.80 | Minimum Commitment Ratio (0–1) required to call the trend committed. |
| RsiPeriod | 14 | 7 | 28 | RSI period used for the pullback-timing gate. |
| RsiHalfBand | 12.0 | 5.0 | 22.0 | Half-width of the RSI mid-band around 50 that the reclaim must occur inside. |
| AtrPeriod | 14 | 7 | 28 | ATR period used for the stop buffer and break-even distance. |
| PullbackLookback | 4 | 2 | 10 | Number of bars whose swing extreme anchors the structural stop. |
| StopAtrBuffer | 0.30 | 0.05 | 1.50 | Stop buffer beyond the swing extreme, as a multiple of ATR. |
| RewardRisk | 2.00 | 1.00 | 4.00 | Take-profit distance as a multiple of the structural stop distance. |
| BreakevenAtr | 1.00 | 0.00 | 3.00 | Lock the stop to entry once price travels this × ATR in favour (0 = off). |
| MaxSpreadPoints | 30 | 1 | 200 | Skip a signal if the current spread (points) is wider than this. |
| Lots | 0.10 | 0.01 | 1.00 | Order volume in lots. |
| Magic | 7314 | 0 | 9,999,999 | Unique identifier so the EA only manages its own trades. |

Recommended Chart Settings
This strategy was designed with liquid, trending instruments in mind — major forex pairs such as EURUSD or GBPUSD, or a strong trender like XAUUSD (gold). The default parameters are tuned for intraday-to-swing timeframes in the M15 to H1 range, where trends have room to develop but signals still appear often enough to study. Because the stop, buffer, and break-even logic are all scaled by ATR, the strategy is intended to adapt to different volatility profiles without manual retuning.
Keep in mind that results will vary considerably across different symbols, timeframes, and market conditions. A pullback-continuation approach relies on the presence of a genuine trend; the same settings that behave well in a trending phase may generate fewer or lower-quality signals during extended ranges. Always test any configuration on your own broker's data before drawing conclusions.
How to Install on MetaTrader 5
- Download the
.ex5file from the link below. - Copy it to your MT5
MQL5\Expertsfolder. - Restart MetaTrader 5 or refresh the Navigator panel.
- Drag the EA onto a chart matching the recommended symbol and timeframe.
- Configure the input parameters and enable Algo Trading.
What to Consider Before Using This EA
The main strength of this approach is its insistence on conviction before entry. By requiring committed body-flow (high CR) and agreement between the EMA relationship and NetBody, the strategy is built to filter out exactly the low-conviction chop where naive pullback entries tend to get whipsawed. The EMA reclaim also provides a natural, structural place for a tight stop, which is what makes the reward-to-risk geometry asymmetric. The trend-flip exit and break-even lock further reflect a disciplined, risk-first design.
There are real limitations to understand, however. Like all trend-following and pullback systems, it depends on the existence of a sustained trend. In prolonged sideways or news-driven whipsaw markets, the Commitment Ratio may still occasionally pass while the EMA reclaim produces false starts, leading to a series of small losses — a drawdown pattern common to this style. The RSI mid-band gate can also cause the strategy to sit out fast, strong moves where momentum never "cools" back toward 50. Because only one position is open at a time, the system trades selectively, which some users may find too infrequent. None of these traits are flaws so much as trade-offs inherent to the design, and understanding them is part of the educational value.
Above all, treat this EA as a framework for studying how regime filters, trend confirmation, and structural risk placement fit together — not as a finished, guaranteed system. Every parameter interacts with the others, and thoughtful forward-testing on a demo account is essential before considering any live use.
Risk Management Tips
Sound risk management matters more than any single entry rule. Consider these general principles as you study this strategy:
- Risk a small, fixed fraction per trade. Many educators suggest risking no more than 1–2% of account equity on any single position. Set your
Lotsso that the distance to the stop-loss reflects that fraction, rather than choosing a lot size arbitrarily. - Start on a demo account. Run the EA in a simulated environment first so you can observe how it behaves across different market conditions without financial exposure.
- Understand drawdown. Even a well-designed strategy will have losing streaks. Know the maximum drawdown you are willing to tolerate before you begin, and size positions accordingly.
- Account for spreads and costs. The
MaxSpreadPointsgate helps, but commissions, slippage, and swaps all affect real-world outcomes and should be part of your testing. - Avoid over-optimization. Fitting parameters too tightly to past data (curve-fitting) often produces results that fail to repeat. Prefer robust settings that work reasonably across a range of conditions.
Risk Warning
Trading foreign exchange, CFDs, and other leveraged financial instruments involves substantial risk of loss and is not suitable for all investors. The strategies and tools discussed on this page are provided for educational purposes only and do not constitute financial advice, investment recommendations, or solicitation to trade. Always consult a qualified financial adviser before making trading decisions. Past backtest performance is not indicative of future results.
Downloads
- Expert Advisor: CommitmentRatioPullback.ex5 (39 downloads)
- Source Code: CommitmentRatioPullback.mq5 (39 downloads)
- Documentation: CommitmentRatioPullback.pdf (41 downloads)