
Disclaimer: This article is for educational and informational purposes only. It does not constitute financial or investment advice. Trading forex and CFDs carries significant risk of loss. Past performance of any strategy — including backtests — does not guarantee future results. Never trade with money you cannot afford to lose.
What Is This Strategy?
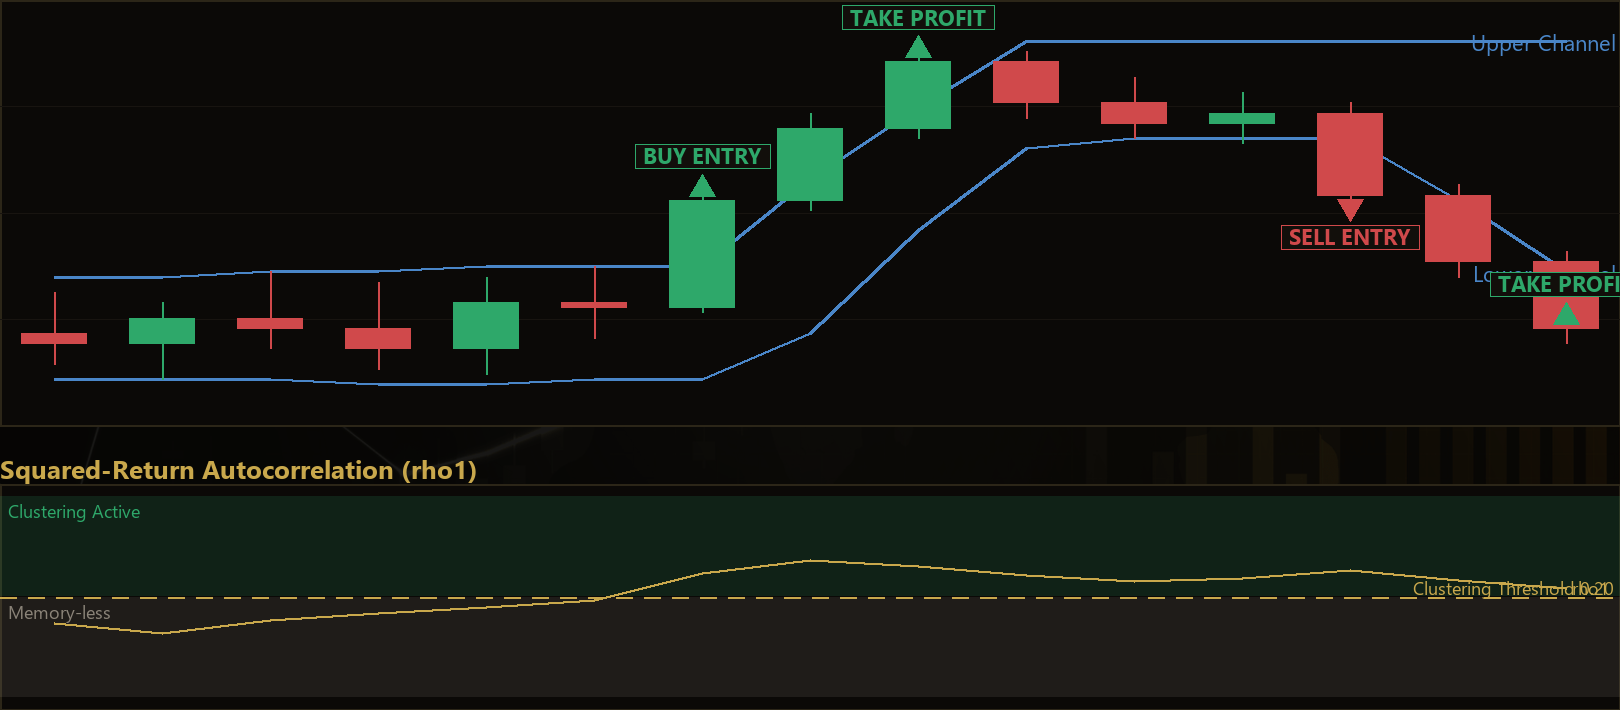
The Clustered Volatility Breakout is a Donchian channel breakout system with a twist: it only permits trades when the market is measurably in a volatility-clustering regime, detected directly from price data using the ARCH signature — the lag-1 autocorrelation of squared returns. A Donchian channel is simply the highest high and lowest low over a recent lookback window, and a "breakout" occurs when price closes beyond that channel. What makes this strategy distinct is the gate that decides when breakouts are even allowed to fire. It is a trend-following, breakout-style approach designed for students of quantitative trading who want to understand how market regime detection can filter noisy signals.
The core idea rests on one of the most robust empirical facts in financial markets: volatility clustering. Large price moves tend to be followed by more large moves, and quiet periods tend to be followed by more quiet — a phenomenon first documented by Benoît Mandelbrot and later formalised in Robert Engle's ARCH (Autoregressive Conditional Heteroskedasticity) framework, work that earned Engle a Nobel Prize. This clustering shows up as positive serial correlation in the squared returns, even when the raw returns themselves look essentially unpredictable. The strategy measures that correlation on a rolling basis and treats it as a switch: only when volatility demonstrably "has memory" does it consider a breakout worth taking.
This makes the Clustered Volatility Breakout a useful learning tool for anyone studying how to distinguish a genuine breakout environment from random chop. It is not a shortcut to results, and it is best understood as a case study in regime-aware entry filtering. Unlike a squeeze system (which keys on low volatility) or a variance-ratio system (which keys on the autocorrelation of raw returns), this strategy keys on the memory of volatility — a genuinely different signal that historically distinguishes breakouts likely to follow through from those likely to snap back.
How It Works
The strategy evaluates its logic once per completed bar on the primary timeframe. Everything is derived from raw OHLC (open, high, low, close) data — there are no external indicators to attach. Here is what happens on each closed bar:
- Regime gate first. The strategy computes
rho1, the lag-1 autocorrelation of squared log-returns over the most recentRetPeriodreturns. This is the ARCH signature of volatility clustering. Ifrho1is greater than or equal toArchThreshold, the market is considered to be "clustering" and entries are permitted. If it is below the threshold, the strategy stands aside entirely — no breakout is taken, no matter how clean it looks. - Build the channel. When clustering is active, the strategy builds a Donchian channel from the
Channelbars immediately preceding the just-closed trigger bar. The channel top is the highest high and the channel bottom is the lowest low across those bars. Because the trigger bar itself is excluded, a genuinely fresh extreme is required to arm a signal. - Long entry signal. The strategy signals a long when clustering is active, the just-closed bar closes above the channel top, and that bar is itself bullish (its close is above its open). The requirement for a decisive up-bar helps avoid marginal pokes above the channel.
- Short entry signal. The mirror image: the strategy signals a short when clustering is active, the just-closed bar closes below the channel bottom, and that bar is itself bearish (close below open).
- Stop-loss logic. Risk is managed with a volatility-based bracket using a simple average True Range (ATR) computed over
AtrPeriodbars. On a long, the stop is placedSlMult × ATRbelow the entry price; on a short,SlMult × ATRabove. - Take-profit logic. The target is placed
TpMult × ATRaway from entry in the direction of the trade. With the default multipliers (1.5 stop, 2.5 target), this creates an asymmetric reward-to-risk profile of roughly 1.67-to-1 before costs. - One position at a time. The strategy holds only one open position per magic number. While a trade is live, the ATR bracket manages it and no new entries are considered. Because the channel excludes the trigger bar, a brand-new extreme must form before the system can re-arm, so entries are naturally spaced out.
Strategy Parameters
| Parameter | Default | Min | Max | Description |
|---|---|---|---|---|
| RetPeriod | 30 | 15 | 80 | Number of returns in the rolling window used to compute the squared-return autocorrelation (the volatility-clustering measure). |
| Channel | 20 | 8 | 60 | Donchian channel length in bars, used to define the breakout level. Excludes the trigger bar. |
| ArchThreshold | 0.20 | 0.00 | 0.60 | Minimum lag-1 squared-return autocorrelation required to consider the market "clustering" and permit entries. Higher values are stricter. |
| AtrPeriod | 14 | 5 | 40 | Number of bars used for the simple average True Range that scales the stop and target. |
| SlMult | 1.5 | 0.5 | 4.0 | Stop-loss distance as a multiple of ATR. |
| TpMult | 2.5 | 0.5 | 6.0 | Take-profit distance as a multiple of ATR. |
| Lots | 0.10 | 0.01 | 1.0 | Fixed trade size in lots. |

Recommended Chart Settings
The Clustered Volatility Breakout is written to run on whatever single timeframe the chart uses, since all of its inputs are derived from primary-timeframe OHLC data. As a general starting point for study, a major forex pair such as EUR/USD on an intraday-to-swing timeframe like the H1 (1-hour) or H4 (4-hour) chart gives the clustering statistic enough bars to be meaningful while keeping trade frequency manageable. Breakout logic tends to behave very differently on lower timeframes, where spread and noise dominate, so shorter charts are generally harder to work with.
Bear in mind that the behaviour of this strategy will vary considerably across different instruments, timeframes, and market conditions. The volatility-clustering gate is sensitive to the character of the series it measures, so a setting that appears reasonable on one pair may behave quite differently on another. Always test any configuration on historical data and a demo account before drawing conclusions.
How to Install on MetaTrader 5
- Download the .ex5 file from the link below
- Copy it to your MT5
MQL5\Expertsfolder - Restart MetaTrader 5 or refresh the Navigator panel
- Drag the EA onto a chart matching the recommended symbol and timeframe
- Configure the input parameters and enable Algo Trading
What to Consider Before Using This EA
Strengths of the approach. The most educational feature of this strategy is its regime filter. Plain channel breakout systems are notorious for bleeding money during choppy, mean-reverting conditions, where every breakout reverses. By requiring evidence of volatility memory before acting, the Clustered Volatility Breakout attempts to sit out exactly those conditions. The ARCH-based gate is grounded in well-established academic research rather than a curve-fitted rule, which makes it a genuinely interesting concept to study. The ATR-based bracket also adapts stops and targets to current volatility rather than using fixed pip distances.
Known limitations. Volatility clustering tells you that large moves are likely to persist — it says nothing about their direction. The autocorrelation of squared returns is direction-blind. The strategy therefore leans on the breakout itself to supply direction, and a high-volatility regime can just as easily produce sharp whipsaws as clean trends. A clustering gate reduces the number of low-quality breakouts taken, but it does not eliminate false breakouts. The strategy also uses a simple (non-Wilder) ATR and a fixed lot size, and it trades only one position at a time, which can mean long idle stretches when clustering is absent.
Where it may underperform. In persistently calm, range-bound markets the clustering statistic will often sit below the threshold and the strategy will simply not trade — which is by design, but can be frustrating if you expect constant activity. In violently reactive markets, breakouts may trigger and then reverse before the target is reached, producing a run of stop-outs. Fast news spikes, thin liquidity sessions, and heavily gapping instruments can all distort both the volatility measure and the breakout levels. As always, no filter can anticipate every market condition.
Risk Management Tips
Sound risk management matters far more than any single entry rule. Whatever you are studying, keep these general principles in mind:
- Risk a small, fixed fraction per trade. A widely taught guideline is to risk no more than 1–2% of account equity on any single position. The fixed
Lotsinput in this strategy does not automatically scale to your account size, so you should calculate an appropriate lot size for your own balance and stop distance. - Understand your drawdown tolerance. Even a well-designed breakout system can experience extended losing streaks. Know in advance how much peak-to-trough decline you are willing to accept, and how you would respond to it.
- Start on a demo account. Test the strategy thoroughly on a demo or paper-trading account across varied market conditions before ever considering real capital. This is the safest way to learn how the regime gate and ATR bracket actually behave.
- Account for costs. Spread, commission, and slippage all erode breakout systems, especially on shorter timeframes. Make sure any historical testing includes realistic trading costs.
- Never over-leverage. Leverage magnifies losses as readily as gains. Use conservative position sizing and avoid risking money you cannot afford to lose.
Risk Warning
Trading foreign exchange, CFDs, and other leveraged financial instruments involves substantial risk of loss and is not suitable for all investors. The strategies and tools discussed on this page are provided for educational purposes only and do not constitute financial advice, investment recommendations, or solicitation to trade. Always consult a qualified financial adviser before making trading decisions. Past backtest performance is not indicative of future results.
Downloads
- Expert Advisor: ClusteredVolatilityBreakout.ex5 (49 downloads)
- Source Code: ClusteredVolatilityBreakout.mq5 (44 downloads)
- Documentation: ClusteredVolatilityBreakout.pdf (52 downloads)