
Disclaimer: This article is for educational and informational purposes only. It does not constitute financial or investment advice. Trading forex and CFDs carries significant risk of loss. Past performance of any strategy — including backtests — does not guarantee future results. Never trade with money you cannot afford to lose.
What Is This Strategy?
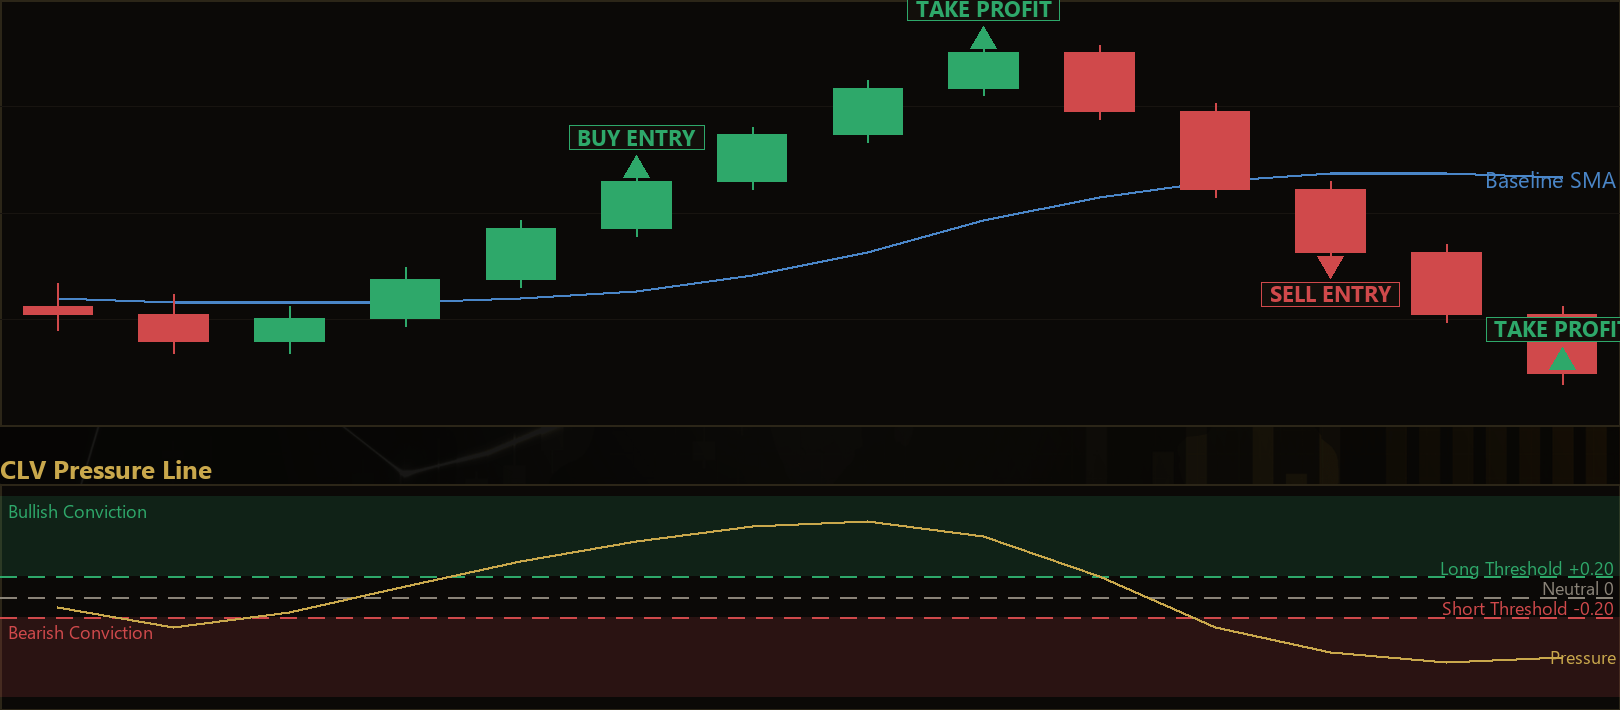
The Closing Bias Persistence Trend is a pure price-action, trend-following strategy for MetaTrader 5 built around a single, underused idea: where each candle closes inside its own range. That location is measured by the Close Location Value (CLV) — a classic price-action statistic defined as (2 × Close − High − Low) / (High − Low), which always sits between −1 and +1. A reading of +1 means the bar closed exactly on its high (buyers finished in control), −1 means it closed on its low (sellers in control), and 0 marks a close at the midpoint of the range.
What makes this approach distinct is that CLV uses only the High, Low, and Close of each bar. It ignores the open entirely, so it is not the same as candle-body flow (Close − Open), and it needs no volume data, so it is not a money-flow indicator. Instead, it reads the "footprint" of who defended each bar's extreme. The strategy smooths this raw closing bias with an exponential moving average (EMA) to build a pressure line, then only acts when that pressure becomes persistent — not on a single noisy reversal bar. A slower moving-average trend gate keeps entries aligned with the prevailing drift.
As a learning tool, this strategy is well suited to traders who want to study how intrabar closing behavior can be turned into a systematic, rules-based signal. It is designed for trending market conditions and is intended to help you understand persistence filtering, conviction thresholds, and volatility-based risk placement — not as a shortcut to any particular outcome. Every rule is symmetric for longs and shorts, and the parameter set is deliberately small and broadly ranged to resist curve-fitting.
How It Works
The strategy evaluates its logic once per completed bar. When a new bar opens, it treats the just-completed candle (shift 1) as the signal candle and works only with closed data, avoiding decisions based on a still-forming bar.
Here is how the pieces fit together:
- The pressure line (persistence of closing bias): For each recent bar, the strategy computes the CLV, then runs an EMA of length
ClvPeriodover those values. The result is a smoothed "pressure line" that also lives between −1 and +1. Persistent closes near the top of the range push the line positive; persistent closes near the bottom push it negative. Because it is smoothed, a single misleading bar barely moves it — the line captures persistence, not a one-bar flicker.
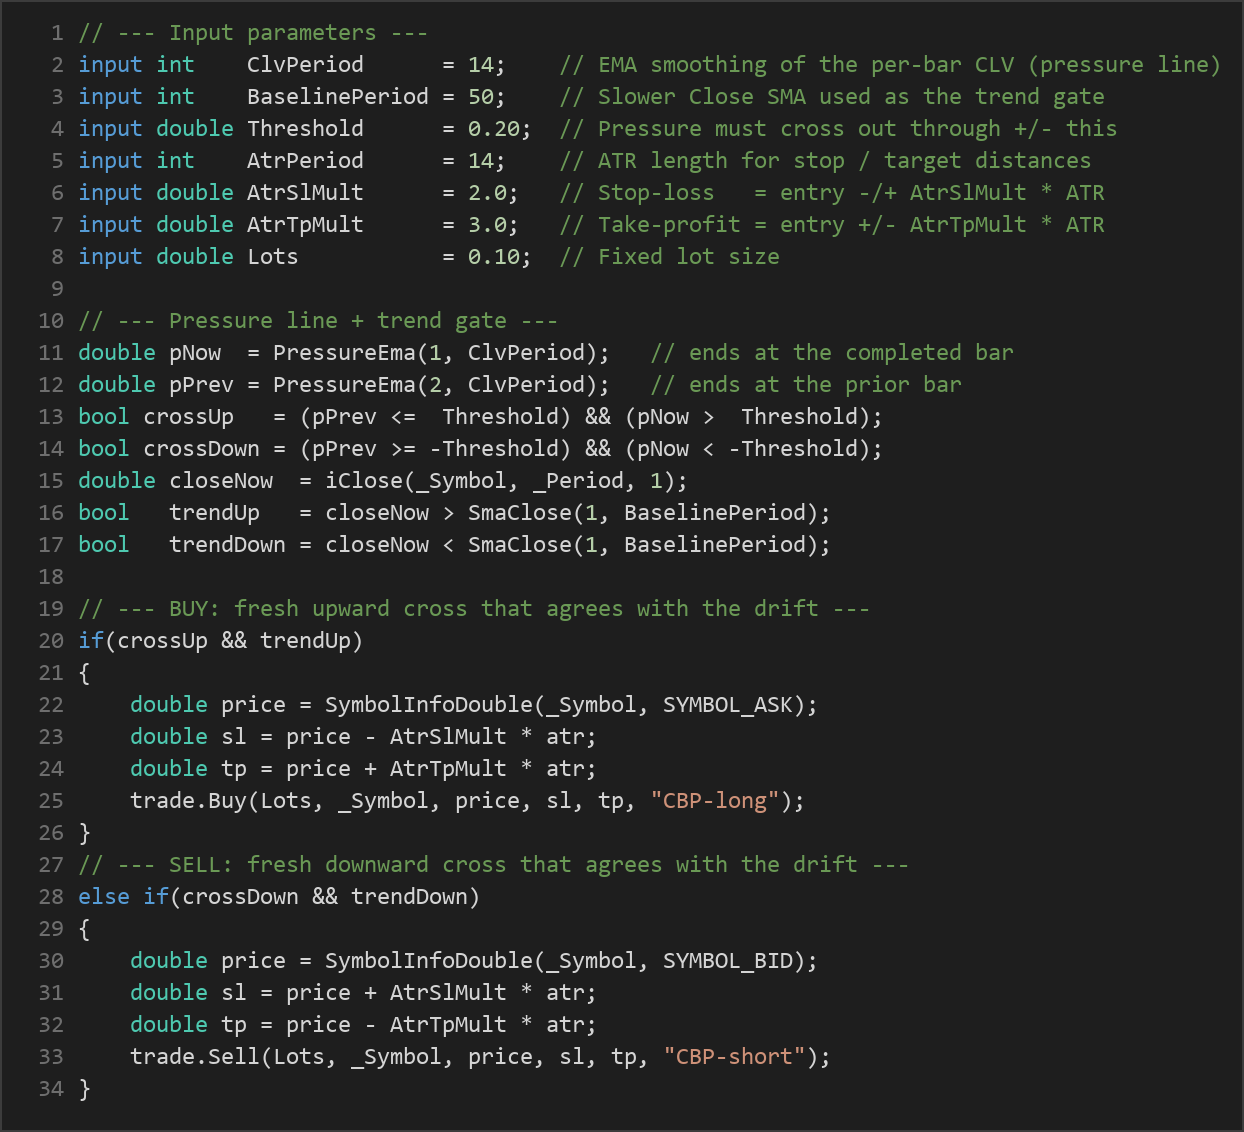
- Entry needs a fresh conviction cross: The strategy does not act simply because pressure is already high. It requires a fresh cross out through a neutral band. A long signal fires when the pressure line was at or below
+Thresholdon the previous bar and then rises above it on the signal bar. A short signal fires when pressure was at or above−Thresholdand then falls below it. This "cross-out" rule times the moment conviction newly emerges rather than chasing a stretched reading.
- Trend gate (anti-chop filter): A signal alone is not enough. The bar's Close must also be on the correct side of a slower Close-based simple moving average (SMA) of length
BaselinePeriod. Longs require Close above the baseline; shorts require Close below it. This gate filters out counter-trend pokes and helps control drawdown in choppy conditions.
- Entry execution: When a fresh upward cross agrees with an up-trend, the strategy signals a long at the Ask. When a fresh downward cross agrees with a down-trend, it signals a short at the Bid. Only one position per magic number is allowed at a time.
- Stop-loss logic: Distances are set from the Average True Range (ATR), a standard volatility measure. The stop is placed
AtrSlMult × ATRaway from entry — below entry for longs, above entry for shorts — so the risk distance adapts to current volatility.
- Take-profit logic: The target is placed
AtrTpMult × ATRfrom entry in the direction of the trade. With the defaults (2.0 stop, 3.0 target), this frames a reward-to-risk structure of roughly 1.5:1 measured in ATR units.
- Exit on opposite conviction: If an open position is running and an opposite fresh conviction cross appears, the strategy closes the position early. Otherwise, the ATR stop or target resolves the trade.
Strategy Parameters
| Parameter | Default | Min | Max | Description |
|---|---|---|---|---|
ClvPeriod |
14 | 5 | 40 | EMA smoothing length for the per-bar Close Location Value — the "pressure line." Higher values react more slowly and demand more persistence. |
BaselinePeriod |
50 | 20 | 200 | Length of the slower Close SMA used as the trend gate. Longer values enforce a stronger prevailing drift before signals are taken. |
Threshold |
0.20 | 0.05 | 0.60 | Conviction band. The pressure line must cross out through +/− this level to trigger an entry. Higher values demand stronger closing bias. |
AtrPeriod |
14 | 7 | 30 | Number of bars used to calculate ATR for stop and target distances. |
AtrSlMult |
2.0 | 1.0 | 4.0 | Stop-loss distance as a multiple of ATR from the entry price. |
AtrTpMult |
3.0 | 1.0 | 6.0 | Take-profit distance as a multiple of ATR from the entry price. |
Lots |
0.10 | 0.01 | 1.0 | Fixed lot size used for every position. |
Recommended Chart Settings
This strategy operates on a single timeframe — whatever timeframe the chart is set to when you attach it. Because CLV-based persistence and ATR sizing are timeframe-agnostic in construction, the strategy can be studied across a range of settings, but it is generally most coherent on the H1 (1-hour) or H4 (4-hour) charts of liquid major forex pairs such as EUR/USD or GBP/USD, where trends have room to develop and spreads are typically tight.
Lower timeframes tend to produce more noise and more frequent, lower-quality crosses, while higher timeframes produce fewer but slower signals. As always, results will vary across different symbols, brokers, and market conditions, so treat any single configuration as a starting point for your own study rather than a fixed recommendation. Test on a demo account first and observe how the pressure line, trend gate, and ATR distances behave on the instrument you choose.
How to Install on MetaTrader 5
- Download the
.ex5file from the link below - Copy it to your MT5
MQL5\Expertsfolder - Restart MetaTrader 5 or refresh the Navigator panel
- Drag the EA onto a chart matching the recommended symbol and timeframe
- Configure the input parameters and enable Algo Trading
What to Consider Before Using This EA
Every strategy has strengths and trade-offs, and understanding both is part of learning to trade systematically.
Strengths of this approach:
- Persistence filtering reduces the impact of single noisy bars, since the smoothed pressure line only shifts meaningfully when closing bias is sustained.
- The fresh-cross requirement times entries to the emergence of conviction rather than to already-stretched readings.
- The trend gate aligns trades with the prevailing drift, which historically helps trend-following systems avoid the worst of range-bound whipsaws.
- ATR-based stops and targets adapt automatically to changing volatility, and the small parameter set limits over-optimization.
Known limitations:
- Like all trend-following logic, it may struggle in sideways or choppy markets, where fresh crosses can appear and then fail as price oscillates around the baseline.
- CLV can behave erratically on bars with very small or zero range (the code returns 0 in that case), so extremely quiet sessions may produce weak signals.
- The opposite-cross exit can close a position before the ATR target is reached, which may cut some moves short during volatile reversals.
- Because sizing is a fixed lot, risk in currency terms scales directly with volatility and account size and is not automatically normalized per trade.
The strategy may underperform during low-volatility ranges, around major news spikes, or when a market transitions between regimes. Treat it as an analytical framework for studying closing-bias persistence, not as a set-and-forget solution.
Risk Management Tips
Sound risk management matters more than any single indicator. As you study this strategy, keep these general principles in mind:
- Position sizing: Size trades so that a stop-out costs only a small, predefined fraction of your account. A common educational guideline is to risk no more than 1–2% of account equity per trade.
- Use a demo account first: Run the strategy on a demo or simulated account until you understand how it behaves across different market conditions before considering any live capital.
- Understand drawdown: Even well-designed trend systems experience losing streaks. Study the depth and length of potential drawdowns so you are prepared for the psychological and financial impact.
- Diversify and avoid over-leverage: Concentrating risk in a single symbol or using excessive leverage can amplify losses quickly. Keep leverage conservative.
- Review parameters thoughtfully: Changing
Threshold,ClvPeriod, or the ATR multipliers changes the risk profile. Adjust deliberately and re-test, rather than optimizing to fit past data.
Risk Warning
Trading foreign exchange, CFDs, and other leveraged financial instruments involves substantial risk of loss and is not suitable for all investors. The strategies and tools discussed on this page are provided for educational purposes only and do not constitute financial advice, investment recommendations, or solicitation to trade. Always consult a qualified financial adviser before making trading decisions. Past backtest performance is not indicative of future results.
Downloads
- Expert Advisor: ClosingBiasPersistenceTrend.ex5 (48 downloads)
- Source Code: ClosingBiasPersistenceTrend.mq5 (49 downloads)
- Documentation: ClosingBiasPersistenceTrend.pdf (55 downloads)