Disclaimer: This article is for educational and informational purposes only. It does not constitute financial or investment advice. Trading forex and CFDs carries significant risk of loss. Past performance of any strategy — including backtests — does not guarantee future results. Never trade with money you cannot afford to lose.
What Is This Strategy?
The Close Location Pressure Trend strategy is a trend-following system built around the Close Location Value (CLV) — a signed, scale-free measure of where price finished inside each bar's high-to-low range. For every completed candle, CLV is calculated as ((Close − Low) − (High − Close)) / (High − Low), producing a number between −1 and +1. A reading near +1 means price settled at the very top of the bar (buyers absorbed every dip), a reading near −1 means it closed at the very bottom (sellers dominated), and a value near zero means the close finished mid-range in indecision. Because CLV ignores volume entirely, it stays clean on forex, where only tick-volume is available and true traded volume is not.
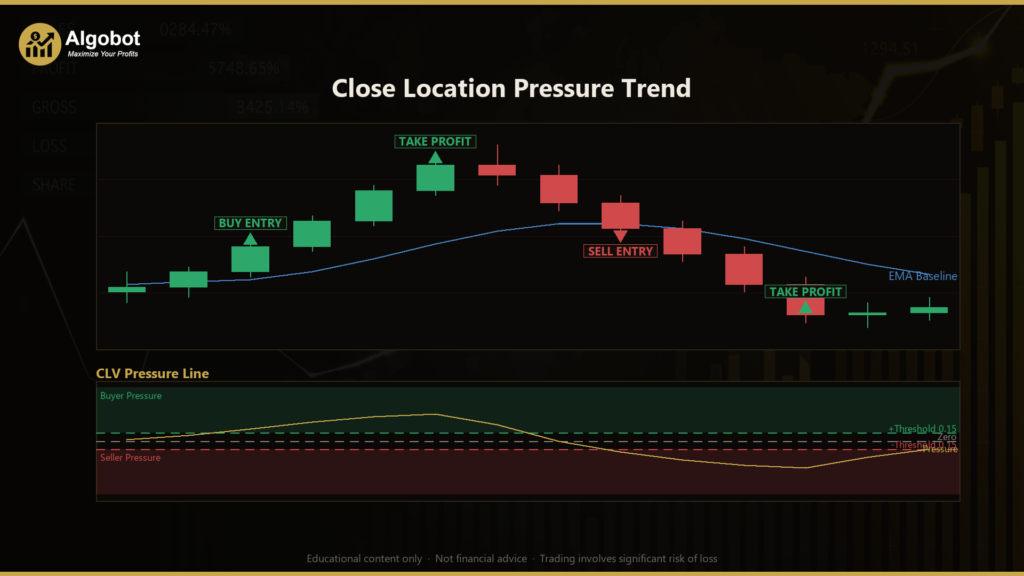
By averaging CLV with an exponential moving average (EMA) — a moving average that weights recent bars more heavily — the strategy builds a "pressure" line. A run of top-of-range closes drives that line positive; a run of bottom-of-range closes drives it negative. When the pressure line makes a fresh surge through a threshold, it flags the moment one side has just taken decisive intrabar control. Unlike Balance of Power (which uses the open) or Internal Bar Strength (a 0-to-1 mean-reversion gauge), CLV is a signed reading of where the market accepted value inside each bar.
This strategy is best viewed as a learning tool for traders who want to understand price-acceptance concepts, EMA-based trend filtering, and ATR-based risk brackets. It is designed for trending market conditions and is not a guaranteed edge — it is a structured example of how intrabar location can be turned into a systematic, symmetric long-and-short trend filter.
How It Works
The strategy acts once per completed bar. On each new bar it recomputes the pressure line, checks the trend baseline, and looks for a fresh threshold cross. Here is the logic in plain English:
- Baseline trend filter: An EMA of the closing price (the "baseline") must be sloping in the trade direction, measured over a configurable lookback. Price must also sit on the correct side of that baseline. This keeps the strategy trading with the dominant drift, never against it.
- Pressure calculation: The raw CLV of each completed bar is smoothed by an EMA into the pressure line. The strategy compares the pressure value now against its value one bar ago to detect a genuine cross, not merely an extended reading.
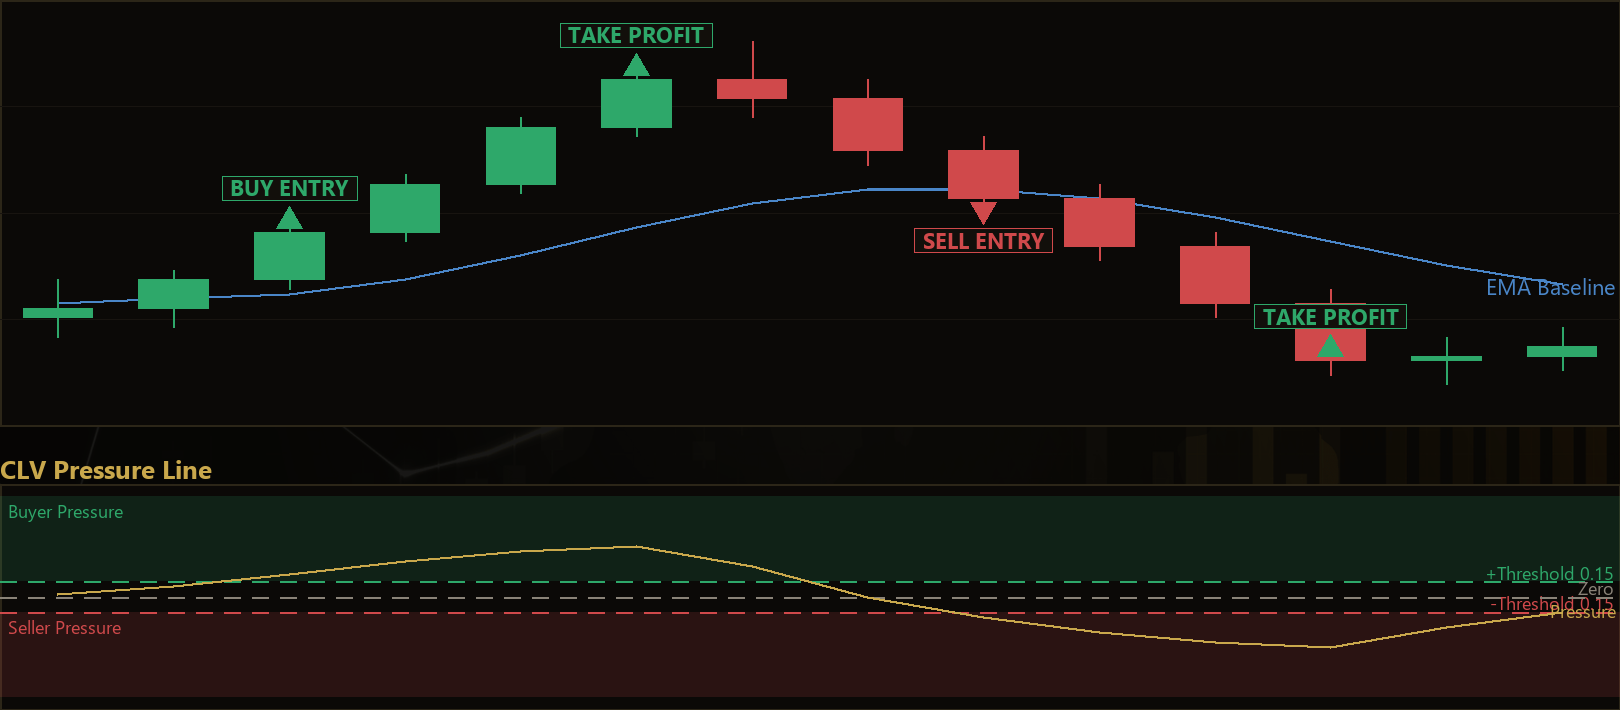
- Long entry signal: The strategy signals a long when the pressure line crosses up through +Threshold on the current bar, while the baseline is rising and price is above it.
- Short entry signal: The strategy signals a short when the pressure line crosses down through −Threshold on the current bar, while the baseline is falling and price is below it.
- Fresh-cross requirement: By requiring the pressure to cross the threshold rather than simply be beyond it, the system aims to catch the moment control shifts decisively, which may help avoid late entries into already-exhausted moves.
- Stop-loss logic: Risk is defined by the Average True Range (ATR) — a volatility measure of the typical bar range. The stop is placed
AtrMult × ATRaway from entry, so the protective distance adapts to current volatility. - Take-profit logic: The take-profit is set at a reward-to-risk multiple of the stop distance (
RewardRisk × stop). For example, a 1.8 reward:risk means the target sits 1.8 times further from entry than the stop. - Position management: Only one position per magic number is allowed at a time. Once open, the fixed stop-loss and take-profit brackets manage the exit — there is no separate trailing or discretionary close.
All calculations use a single, configurable timeframe — the strategy runs on whichever timeframe the chart is set to.
Strategy Parameters
| Parameter | Default | Min | Max | Description |
|---|---|---|---|---|
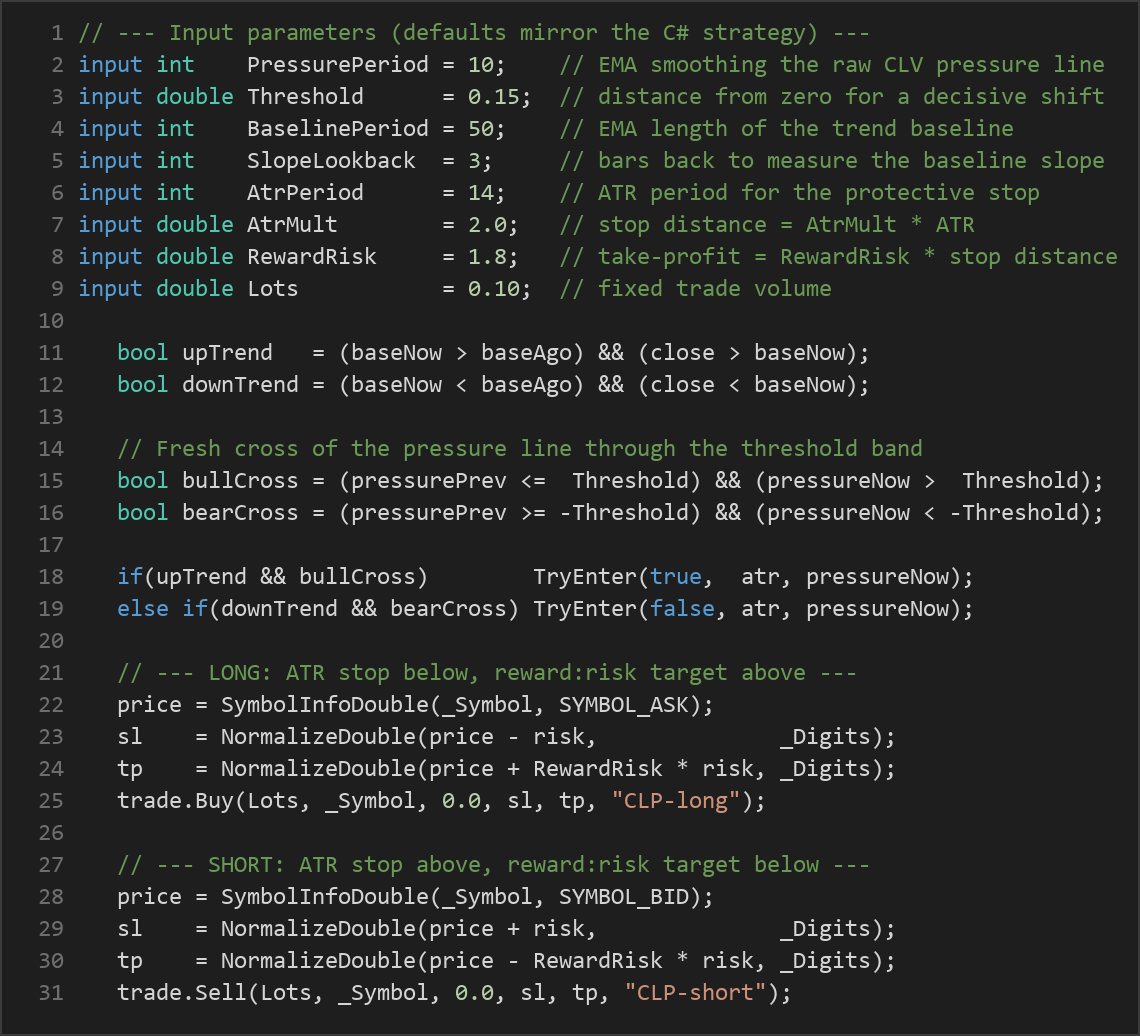
| PressurePeriod | 10 | 3 | 30 | EMA length used to smooth raw CLV into the pressure line. Lower values react faster; higher values are smoother. |
| Threshold | 0.15 | 0.0 | 0.60 | How far from zero the pressure must cross to count as a decisive shift. Higher values demand stronger, rarer signals. |
| BaselinePeriod | 50 | 20 | 150 | EMA length of the trend baseline used for direction and the price-side filter. |
| SlopeLookback | 3 | 1 | 10 | Number of bars back used to measure whether the baseline is rising or falling. |
| AtrPeriod | 14 | 5 | 30 | Lookback period for the ATR that sizes the protective stop. |
| AtrMult | 2.0 | 1.0 | 4.0 | Stop distance as a multiple of ATR. Larger values give the trade more room but risk more per unit. |
| RewardRisk | 1.8 | 1.0 | 4.0 | Take-profit distance as a multiple of the stop distance (reward-to-risk ratio). |
| Lots | 0.10 | 0.01 | 1.0 | Fixed trade volume in lots. |
Recommended Chart Settings
This strategy is symbol- and timeframe-agnostic by design — every calculation reads from the chart's primary timeframe, so it runs on whatever timeframe you attach it to. As a starting point for study, many trend-following systems of this type are explored on major forex pairs (such as EUR/USD or GBP/USD) on intraday timeframes like H1 or H4, where trends have room to develop but noise is reduced compared to very short frames. The default parameters (a 10-period pressure EMA and 50-period baseline) suit a mid-frequency swing style.
Keep in mind that results will vary considerably across different symbols, timeframes, and market regimes. What behaves well on one instrument during a trending period may perform very differently on another instrument or during a range. Always test any configuration on your own broker's data before drawing conclusions.
How to Install on MetaTrader 5
- Download the .ex5 file from the link below
- Copy it to your MT5
MQL5\Expertsfolder - Restart MetaTrader 5 or refresh the Navigator panel
- Drag the EA onto a chart matching the recommended symbol and timeframe
- Configure the input parameters and enable Algo Trading
What to Consider Before Using This EA
Strengths of the approach. The Close Location Pressure Trend logic is transparent and pairs two complementary ideas: a price-acceptance oscillator (CLV) for timing, and an EMA baseline for context. Requiring both a fresh threshold cross and trend alignment is a disciplined double-filter that can reduce impulsive, counter-trend entries. Because CLV is volume-free, it behaves consistently on forex data, and the ATR-based stop lets risk scale with current volatility rather than a fixed pip distance.
Known limitations. Like all trend-following systems, this strategy is vulnerable to choppy, sideways markets, where the baseline flips direction frequently and pressure crosses generate signals that quickly reverse — the classic "whipsaw" problem. The fresh-cross requirement helps but does not eliminate this. The CLV reading is also sensitive to bars with unusually wide ranges or gaps, which can distort a single reading before the EMA smooths it. Finally, a fixed reward:risk take-profit means the strategy will exit winning trends early if the target is set too tight, or give back open profit if a trend reverses before hitting target.
When it may underperform. Expect weaker behavior during low-volatility consolidation, during major news spikes that blow through stops, and on very low timeframes where spread and noise dominate the CLV signal. No single parameter set is optimal across all conditions, and over-optimizing on past data ("curve-fitting") can produce settings that look strong historically but fail to generalize.
Risk Management Tips
Sound risk management matters more than any single entry signal. Consider these general principles as part of your education:
- Risk a small, fixed fraction per trade. A common guideline is to risk no more than 1–2% of account equity on any single position, adjusting your lot size so the ATR-based stop distance matches that fraction.
- Size positions deliberately. The fixed
Lotsinput does not scale with account size or volatility — calculate an appropriate volume for your balance rather than accepting the default blindly. - Test on a demo account first. Run the strategy on a demo or paper account across varied market conditions before committing real capital, and study how it behaves in both trends and ranges.
- Understand drawdown. Every strategy endures losing streaks. Know the maximum peak-to-trough decline you are willing to tolerate, and confirm the system's historical drawdown fits your risk appetite.
- Diversify and avoid overexposure. Running one strategy on many correlated pairs at once can multiply your true risk beyond what a single-position rule suggests.
- Keep expectations realistic. Treat this EA as a framework for learning systematic trading — not as a substitute for your own judgment and ongoing risk oversight.
Risk Warning
Trading foreign exchange, CFDs, and other leveraged financial instruments involves substantial risk of loss and is not suitable for all investors. The strategies and tools discussed on this page are provided for educational purposes only and do not constitute financial advice, investment recommendations, or solicitation to trade. Always consult a qualified financial adviser before making trading decisions. Past backtest performance is not indicative of future results.
Downloads
- Expert Advisor: CloseLocationPressureTrend.ex5 (46 downloads)
- Source Code: CloseLocationPressureTrend.mq5 (53 downloads)
- Documentation: CloseLocationPressureTrend.pdf (54 downloads)