Disclaimer: This article is for educational and informational purposes only. It does not constitute financial or investment advice. Trading forex and CFDs carries significant risk of loss. Past performance of any strategy — including backtests — does not guarantee future results. Never trade with money you cannot afford to lose.
What Is This Strategy?
Capacitive Charge Reversion is a mean-reversion expert advisor (EA) for MetaTrader 5 that borrows a metaphor from electronics — the leaky capacitor — to decide when price has stretched too far from its own local equilibrium. A mean-reversion strategy assumes that when price drifts far from a fair-value baseline, it tends to be pulled back toward that baseline over time. Instead of relying on a conventional indicator such as RSI or Bollinger Bands, this strategy builds its own custom oscillator, called the charge, from first principles.
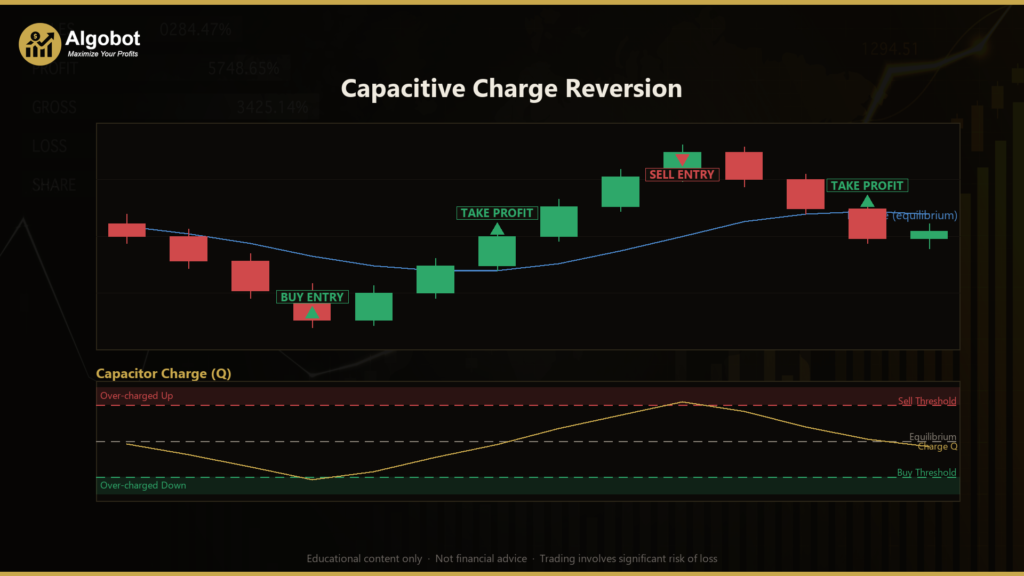
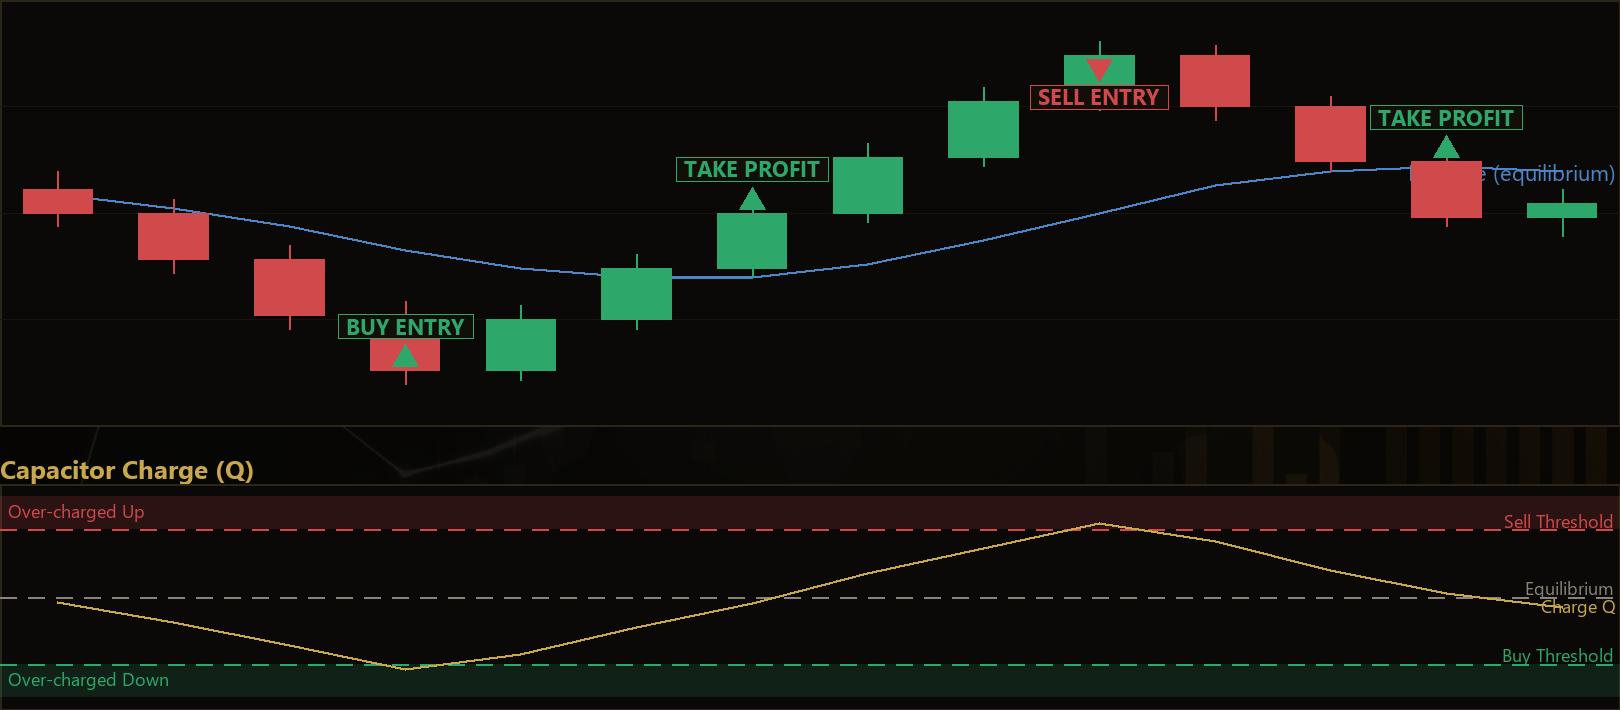
The core idea is to treat the distance between price and its recent average as a voltage, and to accumulate that voltage into a stored charge using a leaky integrator — a running total that also decays a little on every bar. A brief spike barely charges the system and quickly leaks away, which the strategy interprets as noise or genuine repricing. But price that stays persistently on one side of its baseline keeps pumping charge in faster than it leaks out, building a stored "reversion potential" that the strategy treats as primed to discharge back through equilibrium. When that charge crosses a self-calibrating threshold, the EA fades the move — selling into over-extended rallies and buying into over-extended declines.
This EA is best understood as a learning tool for traders who want to study adaptive, self-normalizing systems rather than fixed indicator levels. Because the baseline, the dispersion scale, and the trigger threshold are all recomputed on every bar, the strategy adapts to each symbol and timeframe with no hard-coded price levels. It is well suited to range-bound or oscillating market conditions and less suited to strong, sustained trends. If you are curious how signal processing concepts like integration, decay, and normalization can be applied to price data, this strategy is a compact and readable example.
How It Works
The strategy processes one closed bar at a time on the primary timeframe, so it never repaints or reacts to an unfinished candle. On each newly closed bar it recalculates its full state from scratch.
Here is what the strategy does step by step:
- Local equilibrium (baseline): It computes the simple mean of the closing prices over the last
Windowbars. This mean is treated as the market's local fair value. - Robust scale (dispersion): It computes the mean absolute deviation (MAD) — the average distance of each close from the mean — over the same window. MAD is a robust measure of how "wide" recent price action has been.
- Voltage (normalized displacement): It divides the current displacement (close minus mean) by the MAD. This produces a normalized value that describes how far price has strayed in units of its own recent dispersion.
- Charge (leaky integrator): It updates a running charge with the formula
Q = Decay × Q + voltage. TheDecayfactor (a number below 1) slowly bleeds old charge away, so only persistent displacement accumulates into a large charge. - Self-calibrating threshold: It measures the standard deviation of the charge over the last
ChargeWindowbars and multiplies it byThresholdMult. Because the threshold is derived from the charge's own recent volatility, the system tunes itself to each market automatically.
The strategy then signals entries and exits as follows:
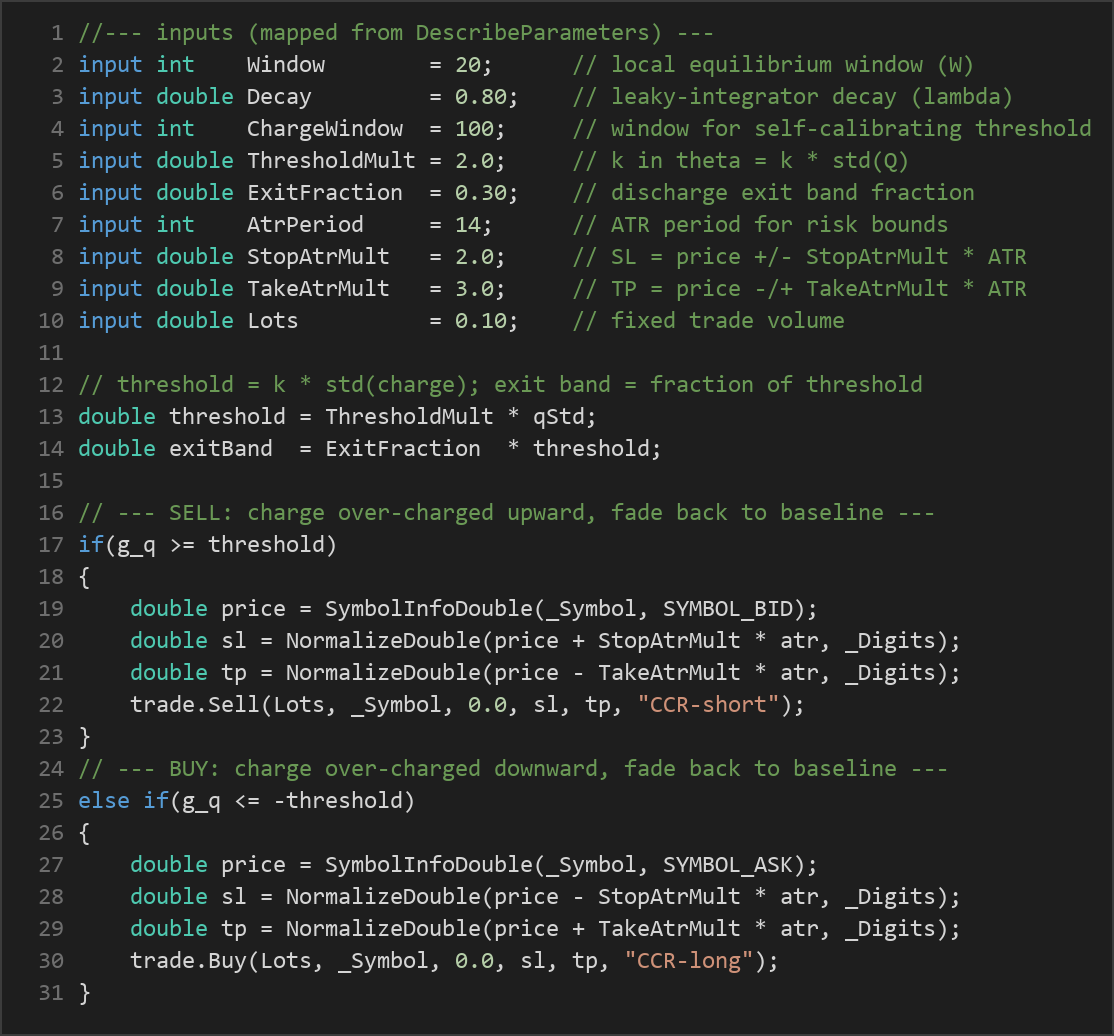
- Sell signal: When the charge rises to or above the positive threshold, the market is considered "over-charged" upward. The strategy signals a sell, fading the move back toward the baseline.
- Buy signal: When the charge falls to or below the negative threshold, the market is considered "over-charged" downward, and the strategy signals a buy.
- Exit on discharge: For an open position, the strategy exits when the charge relaxes back inside an exit band (
ExitFraction × thresholdaround zero) — meaning the stored energy has discharged — or when the charge flips all the way to the opposite extreme. - Stop-loss logic: Risk is bounded using the Average True Range (ATR), a volatility measure. The stop-loss is placed
StopAtrMult × ATRaway from entry, on the losing side of the trade. - Take-profit logic: The take-profit is placed
TakeAtrMult × ATRaway from entry, on the favorable side.
Only one position is held at a time. After a position closes, the strategy waits for a later bar to generate a fresh signal.
Strategy Parameters
| Parameter | Default | Min | Max | Description |
|---|---|---|---|---|
| Window | 20 | 8 | 60 | Number of bars used to compute the local equilibrium (mean) and the mean absolute deviation scale. |
| Decay | 0.80 | 0.50 | 0.97 | Leaky-integrator decay factor (lambda). Values closer to 1 retain charge longer; lower values leak faster and react more to recent bars. |
| ChargeWindow | 100 | 30 | 300 | Number of past charge values used to measure the charge's volatility for the self-calibrating threshold. |
| ThresholdMult | 2.0 | 1.0 | 4.0 | Multiplier (k) applied to the charge's standard deviation to set the entry threshold. Higher values require more extreme charge before signaling. |
| ExitFraction | 0.30 | 0.0 | 0.80 | Fraction of the threshold that defines the discharge exit band around zero. Larger values close positions sooner. |
| AtrPeriod | 14 | 7 | 30 | Number of bars used to calculate ATR for stop-loss and take-profit distances. |
| StopAtrMult | 2.0 | 0.5 | 5.0 | Stop-loss distance as a multiple of ATR. |
| TakeAtrMult | 3.0 | 0.5 | 8.0 | Take-profit distance as a multiple of ATR. |
| Lots | 0.10 | 0.01 | 1.0 | Fixed trade volume in lots for each position. |
Recommended Chart Settings
Capacitive Charge Reversion is a single-timeframe strategy that reads the symbol and timeframe of the chart it is attached to. It was designed as a general-purpose mean-reversion study rather than for one specific instrument, so it is most instructive on markets that tend to oscillate around a value area — for example major forex pairs on intraday timeframes such as M15, M30, or H1.
Because every calculation is normalized and self-calibrating, the same default parameters can be applied to different symbols without manual re-scaling. That said, results will vary considerably across different market conditions, instruments, and broker data feeds. Always test the strategy on the exact symbol and timeframe you intend to study before drawing any conclusions, and expect its behavior to differ between quiet ranging periods and strong trending phases.
How to Install on MetaTrader 5
- Download the .ex5 file from the link below
- Copy it to your MT5
MQL5\Expertsfolder - Restart MetaTrader 5 or refresh the Navigator panel
- Drag the EA onto a chart matching the recommended symbol and timeframe
- Configure the input parameters and enable Algo Trading
What to Consider Before Using This EA
The main strength of this approach is that it is fully self-adapting. There are no fixed overbought or oversold levels to tune per symbol; the baseline, the dispersion scale, and the trigger threshold all recompute each bar from the market's own recent behavior. The leaky integrator is also a thoughtful way to distinguish a brief spike (which barely charges the system) from persistent one-sided drift (which accumulates), and the ATR-based stops keep risk proportional to current volatility.
The known limitations are inherent to any mean-reversion method. Fading extended moves works well when price oscillates around a value area, but it can struggle badly during strong, sustained trends — exactly the conditions where an "over-charged" reading may keep getting more extreme rather than reverting. In a powerful trend the strategy may repeatedly signal counter-trend entries that hit their stop-loss. The fixed lot size means position risk is not scaled to account equity, and the one-position-at-a-time design can leave the EA idle for long stretches. As with any parameter-driven system, there is also a risk of over-fitting if you tune the inputs too tightly to historical data.
Treat this EA as a framework for studying adaptive mean reversion, not as a finished, drop-in solution.
Risk Management Tips
Sound risk management matters more than any single signal rule. Consider these general principles as you study the strategy:
- Risk a small, fixed fraction per trade. A common educational guideline is to risk no more than 1–2% of account equity on any single position. Because this EA uses a fixed lot size, you may need to adjust
Lotsso the ATR-based stop distance aligns with that fraction on your account. - Always start on a demo account. Run the strategy on a demo or simulated account first so you can observe its behavior across different market conditions without financial exposure.
- Understand drawdown. Study how deep and how long the strategy's losing streaks can be. A sequence of counter-trend stop-outs during a strong move can produce meaningful drawdown.
- Match position size to your risk tolerance. Larger lots amplify both gains and losses; size conservatively while learning.
- Review and adjust regularly. Markets change, and a self-calibrating system still needs periodic review to confirm its assumptions still hold on your chosen instrument.
Risk Warning
Trading foreign exchange, CFDs, and other leveraged financial instruments involves substantial risk of loss and is not suitable for all investors. The strategies and tools discussed on this page are provided for educational purposes only and do not constitute financial advice, investment recommendations, or solicitation to trade. Always consult a qualified financial adviser before making trading decisions. Past backtest performance is not indicative of future results.
Downloads
- Expert Advisor: CapacitiveChargeReversion.ex5 (43 downloads)
- Source Code: CapacitiveChargeReversion.mq5 (41 downloads)
- Documentation: CapacitiveChargeReversion.pdf (43 downloads)