Disclaimer: This article is for educational and informational purposes only. It does not constitute financial or investment advice. Trading forex and CFDs carries significant risk of loss. Past performance of any strategy — including backtests — does not guarantee future results. Never trade with money you cannot afford to lose.
What Is This Strategy?
The Camarilla H3 L3 Rejection Fade is an intraday mean-reversion strategy built on Camarilla pivot points — a set of daily support and resistance levels calculated from the previous day's high, low, and close. Mean reversion is the trading style that assumes price which stretches too far from a central value tends to snap back toward it, and Camarilla pivots give that idea a concrete map: the H3 and L3 levels act as the "reversion walls" of a normal (non-trending) session, while H4 and L4 mark the point where the day has instead broken into a trend.
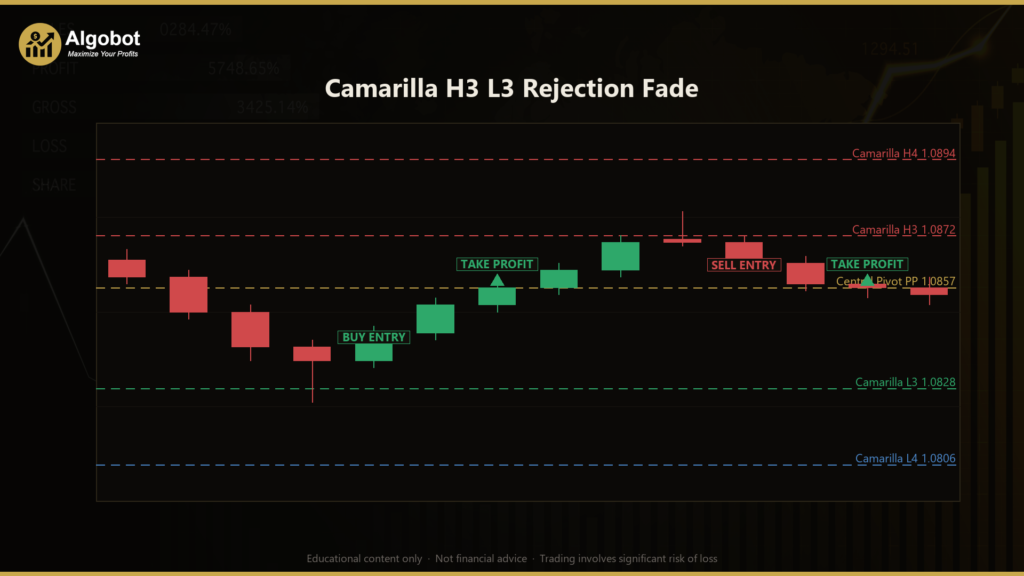
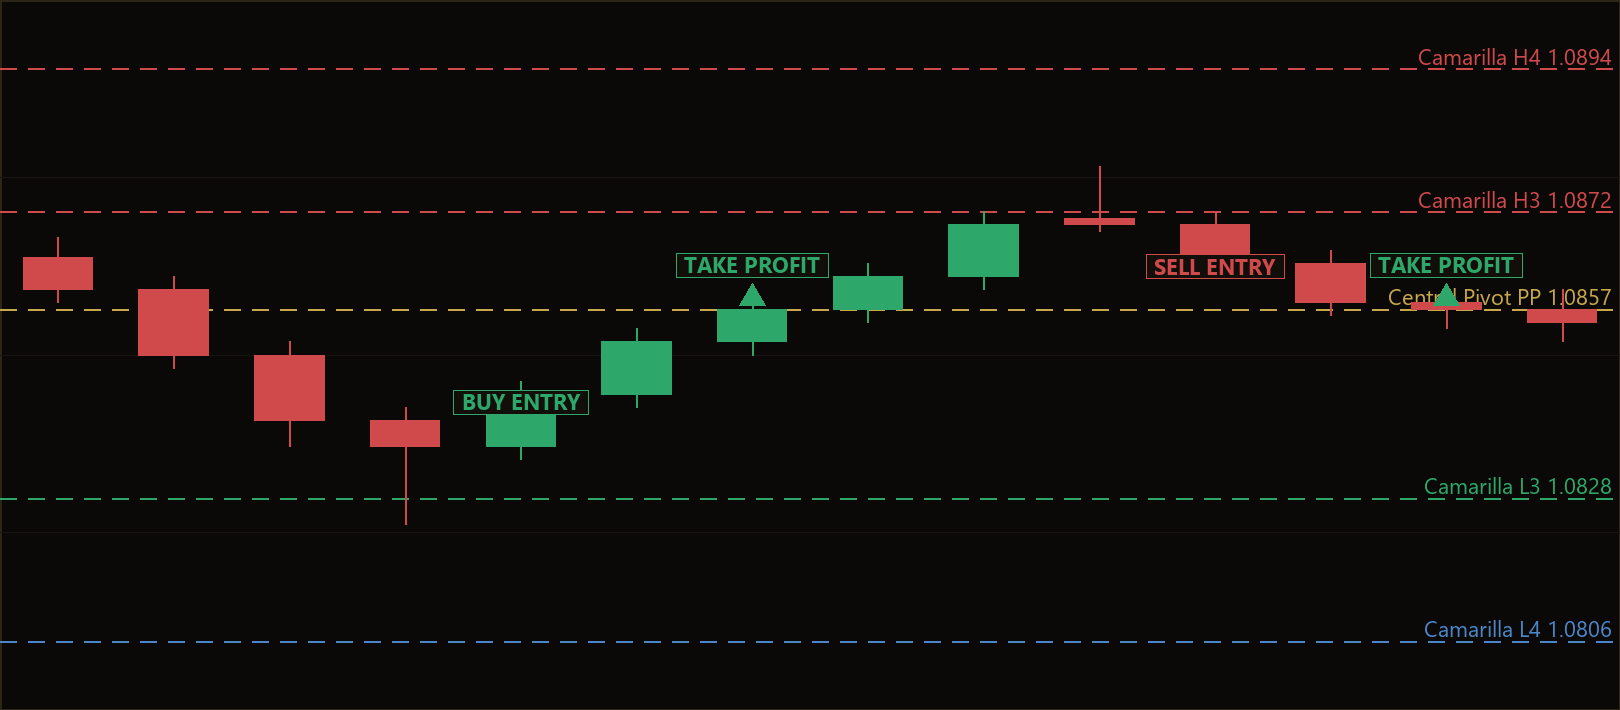
The core concept is deliberately narrow. On a typical range-bound day, price that pushes up into H3 often gets sold back toward the central pivot, and price that flushes down into L3 often gets bought back up. This strategy tries to fade — that is, trade against — only that first stretch to the wall, and only when the market shows a clear rejection. A rejection candle is one whose wick poke to or through the level but whose body closes back inside it, a visual sign that the level held. When H4 or L4 give way instead, the day is more likely trending, and the fade thesis is treated as dead.
As a learning tool, this strategy is well suited to traders who want to study pivot-based mean reversion, candle-rejection reading, and structural stop placement in a single, self-contained system. It is not a "set and forget" money machine, and it is framed here as an analysis of a specific market behaviour rather than a profit opportunity. If you are learning how support/resistance levels, ATR-based filtering, and reward-to-risk gating fit together, this Expert Advisor (EA) is a compact, readable example.
How It Works
The strategy rebuilds its Camarilla levels every new trading day from the prior day's aggregated high, low, and close, and then watches the primary-timeframe bars for the first clean rejection at H3 or L3. All levels are derived on a single timeframe — the code detects a change in the bar's calendar date rather than reading a separate daily chart.
Level construction (each new day):
- The previous day's range
R = High − Lowis measured. - The central pivot is
PP = (High + Low + Close) / 3. H3 = Close + R × (1.1 / 4)andH4 = Close + R × (1.1 / 2)sit above.L3 = Close − R × (1.1 / 4)andL4 = Close − R × (1.1 / 2)sit below.
Pre-trade filters:
- The strategy acts once per completed bar, never on the still-forming bar.
- A day is skipped as "too dead" if the prior-day range is smaller than
MinRangeMult × ATR— there needs to be real range to fade. ATR (Average True Range) is a volatility gauge built from the same primary bars. - Only one open fade is allowed at a time, and only one fade per side (long and short) per session.
Short fade — the strategy signals a sell when:
- It is the first H3 touch of the day and no short has yet been taken.
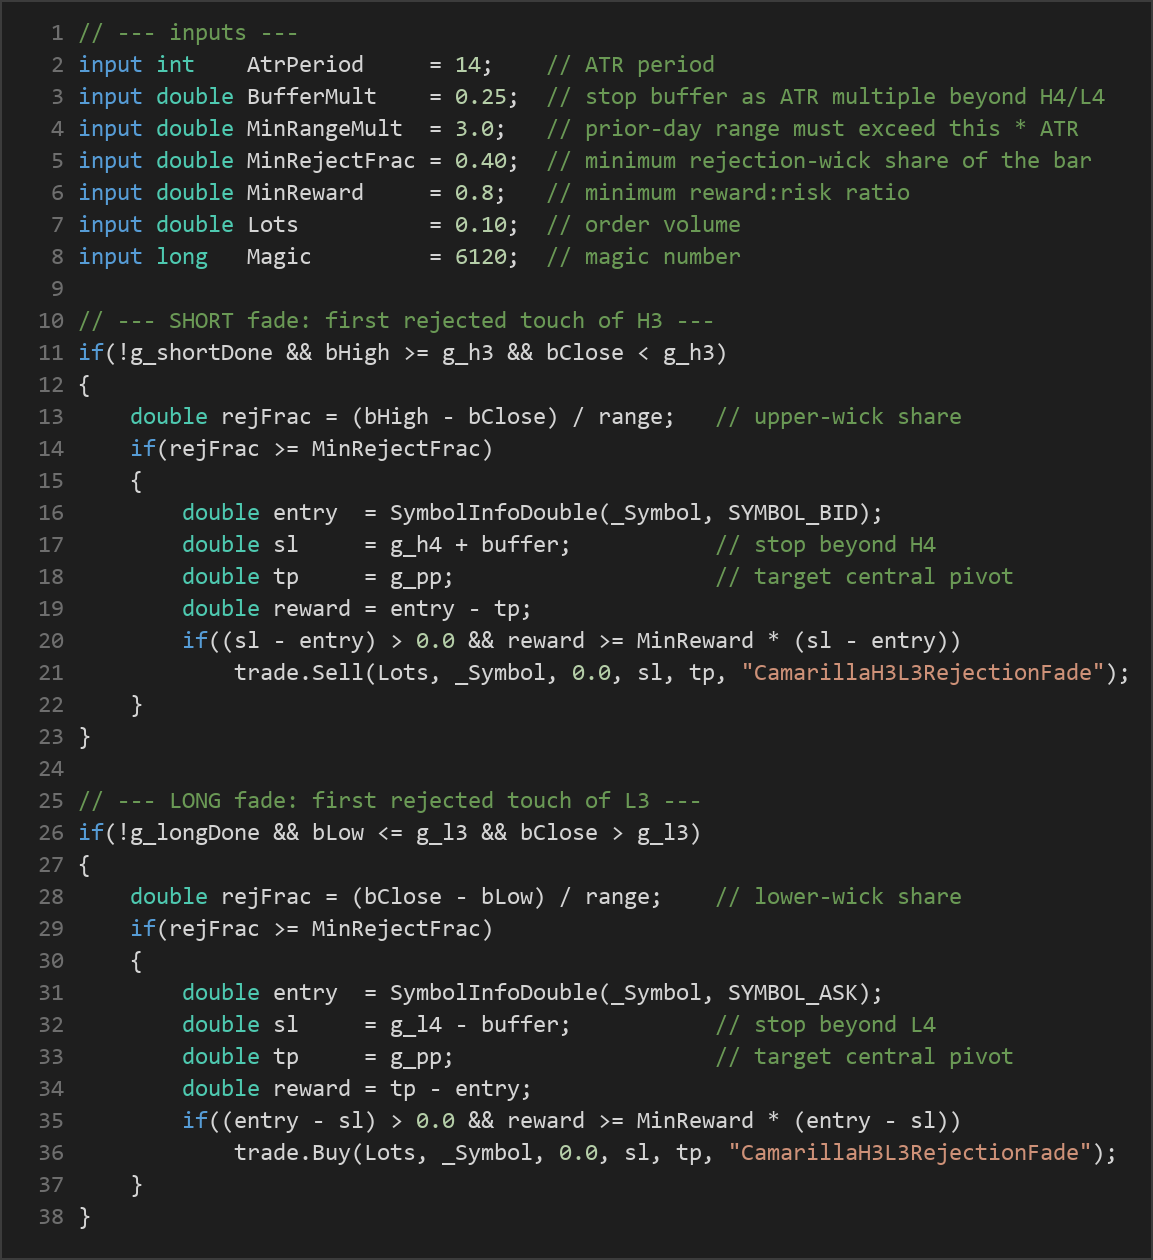
- The just-closed bar's high reached or exceeded H3, but its close finished below H3 (a rejection).
- The upper-wick share of the bar,
(High − Close) / range, is at leastMinRejectFrac, confirming a meaningful rejection tail. - The reward-to-risk test passes (see below).
Long fade — the strategy signals a buy when:
- It is the first L3 touch of the day and no long has yet been taken.
- The just-closed bar's low reached or dropped below L3, but its close finished above L3.
- The lower-wick share,
(Close − Low) / range, is at leastMinRejectFrac. - The reward-to-risk test passes.
Stop-loss logic:
- For shorts, the stop sits just beyond H4 at
H4 + BufferMult × ATR. - For longs, the stop sits just beyond L4 at
L4 − BufferMult × ATR. - The reasoning is structural: if H4/L4 breaks, the market has likely turned into a trend day and the mean-reversion idea no longer applies.
Take-profit logic:
- Both sides target the central pivot PP, the natural reversion magnet.
- Before any order is sent, the strategy checks that reward is at least
MinReward × risk. If the potential move to PP is too small relative to the distance to the stop, the trade is skipped.
Strategy Parameters
| Parameter | Default | Min | Max | Description |
|---|---|---|---|---|
| AtrPeriod | 14 | 5 | 40 | Number of bars used to calculate ATR, which sizes the stop buffer and gauges daily volatility. |
| BufferMult | 0.25 | 0.0 | 2.0 | Extra stop distance beyond H4/L4, expressed as a multiple of ATR. Larger values give the stop more breathing room. |
| MinRangeMult | 3.0 | 0.0 | 12.0 | The prior day's range must exceed this multiple of ATR; filters out low-range, low-conviction days. |
| MinRejectFrac | 0.40 | 0.0 | 0.9 | Minimum rejection-wick share of the signal bar. Higher values demand a more pronounced rejection tail. |
| MinReward | 0.8 | 0.3 | 3.0 | Minimum reward-to-risk ratio required for a trade to be taken. |
| Lots | 0.10 | 0.01 | 1.0 | Fixed order volume (lot size) per trade. |
Recommended Chart Settings
This strategy was designed as an intraday system, so it is most naturally studied on an intraday timeframe such as M15 or M30, where enough bars form during a session for a rejection candle to develop but the day-level Camarilla structure still dominates. Because the daily levels are aggregated from the primary-timeframe bars, the chart timeframe you attach it to is the timeframe it aggregates from — so choose it deliberately.
Camarilla pivots are most commonly applied to liquid instruments with clear daily ranges, such as major forex pairs (for example EUR/USD or GBP/USD) or index CFDs. Whatever you choose, remember that results will vary considerably across different symbols, sessions, and market regimes. A parameter set that behaves well on one instrument may behave very differently on another, and no single configuration should be assumed to transfer cleanly.
How to Install on MetaTrader 5
- Download the
.ex5file from the link below. - Copy it to your MT5
MQL5\Expertsfolder. - Restart MetaTrader 5 or refresh the Navigator panel.
- Drag the EA onto a chart matching the recommended symbol and timeframe.
- Configure the input parameters and enable Algo Trading.
What to Consider Before Using This EA
The main strength of this approach is its discipline. It does not fade every touch of a level — it waits for the first touch, demands a genuine rejection candle with a measurable wick, filters out dead low-range days, places a structurally logical stop beyond the H4/L4 breakout wall, and refuses trades whose reward-to-risk falls short. That layered gating is a good study in how professional mean-reversion setups try to separate a normal reversion day from a trend day.
The limitations are inherent to mean reversion itself. The single biggest risk to any fade strategy is the trend day: when price breaks H4 or L4 and keeps running, the fade is on the wrong side of a strong move, and the stop — though structural — will be hit. On such days a fader can take a string of losses. The strategy's filters reduce but cannot eliminate this. It may also underperform during high-impact news, session opens with gaps, or unusually volatile regimes where levels are sliced through rather than respected.
There are also mechanical caveats. Camarilla levels here are rebuilt from an aggregated "day" defined by calendar date in the bar's time; broker server time and daylight-saving shifts can move where a session boundary falls. The "one fade per side per day" rule means the EA is selective by design and may go long stretches without trading, which some users mistake for a malfunction. None of this makes the strategy good or bad — it simply means you should understand its behaviour before drawing conclusions.
Risk Management Tips
- Size positions to a fixed fractional risk. A common educational guideline is to risk no more than 1–2% of account equity on any single trade, and to derive your lot size from the stop distance rather than trading a fixed lot blindly.
- Test on a demo account first. Run the EA in MT5's Strategy Tester and on a demo account across many sessions and market conditions before considering any live use.
- Understand drawdown. Even a well-constructed strategy will experience losing streaks. Know the maximum peak-to-trough decline you are willing to tolerate, and decide in advance how you will respond to it.
- Respect correlation and exposure. Running similar fade logic on several correlated pairs at once can multiply your effective risk beyond what any single trade suggests.
- Keep expectations grounded. Backtests and demo results are learning data, not predictions. Treat this EA as a way to study a market behaviour, not as a guaranteed outcome.
Risk Warning
Trading foreign exchange, CFDs, and other leveraged financial instruments involves substantial risk of loss and is not suitable for all investors. The strategies and tools discussed on this page are provided for educational purposes only and do not constitute financial advice, investment recommendations, or solicitation to trade. Always consult a qualified financial adviser before making trading decisions. Past backtest performance is not indicative of future results.
Downloads
- Expert Advisor: CamarillaH3L3RejectionFade.ex5 (43 downloads)
- Source Code: CamarillaH3L3RejectionFade.mq5 (63 downloads)
- Documentation: CamarillaH3L3RejectionFade.pdf (64 downloads)