
Disclaimer: This article is for educational and informational purposes only. It does not constitute financial or investment advice. Trading forex and CFDs carries significant risk of loss. Past performance of any strategy — including backtests — does not guarantee future results. Never trade with money you cannot afford to lose.
What Is This Strategy?
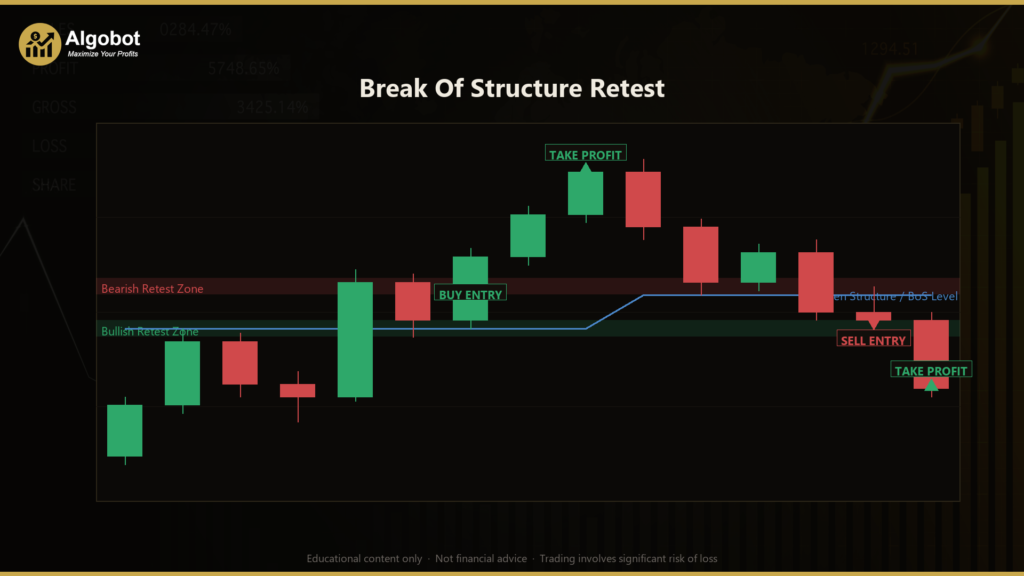
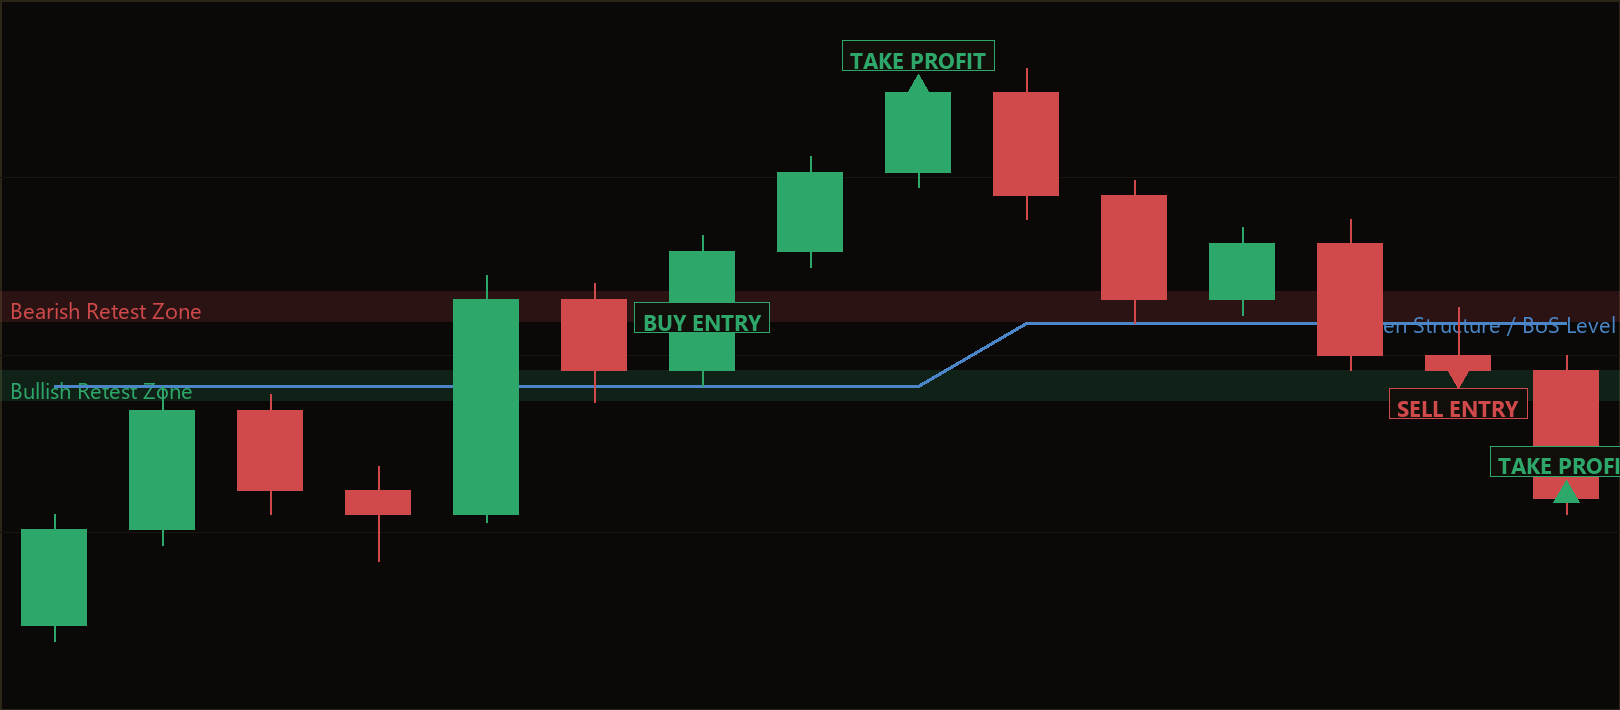
The Break Of Structure Retest strategy is a pure price-action continuation system built around the concept of a Break of Structure (BoS) — an ICT-style ("Inner Circle Trader") method of reading the market through swing highs and swing lows rather than through lagging indicators. A swing pivot is simply a turning point on the chart: a bar whose high (or low) stands above (or below) the bars on either side of it. When price decisively closes through one of these established turning points, the strategy treats it as evidence that market structure has shifted in that direction.
Unlike many automated systems that rely on moving averages, oscillators, or other calculated indicators, this expert advisor (EA) derives every decision from raw OHLC (open, high, low, close) candle data on a single timeframe. There are no indicator handles, no smoothing, and no repainting buffers — just structure mapping and a disciplined retest entry. This makes it a clean, transparent example for traders who want to understand how Smart Money Concepts and market structure trading actually translate into code.
As a learning tool, the Break Of Structure Retest strategy is best suited to intermediate students of technical analysis who already understand candlestick basics and want to study how a trend-continuation entry is structured. It is designed for trending or impulsive market conditions, where a strong move breaks a prior swing and then pulls back before continuing. It is not designed for tight, choppy, sideways ranges, and studying where it struggles is just as instructive as studying where it works.
How It Works
The strategy operates only on fully closed bars — it ignores the still-forming candle so that signals never flicker or change after the fact. Each new bar, it maps structure, checks for a pending entry, and then looks for a fresh break. Here is the logic in plain English:
- Mapping structure: The strategy scans for fractal swing pivots. A swing high is a bar whose high strictly exceeds the highs of its
PivotLengthneighbours on both sides; a swing low is the mirror image. These confirmed pivots become the reference levels for everything that follows. - Detecting the break (BoS): A bullish Break of Structure is registered when a bar closes above the most recent confirmed swing high. A bearish BoS is registered when a bar closes below the most recent confirmed swing low. The broken level is remembered as the "retest zone."
- Waiting for the retest: After a break, the broken level is expected to flip roles — broken resistance is treated as new support (and broken support as new resistance). The strategy waits for price to pull back into that zone rather than chasing the breakout.
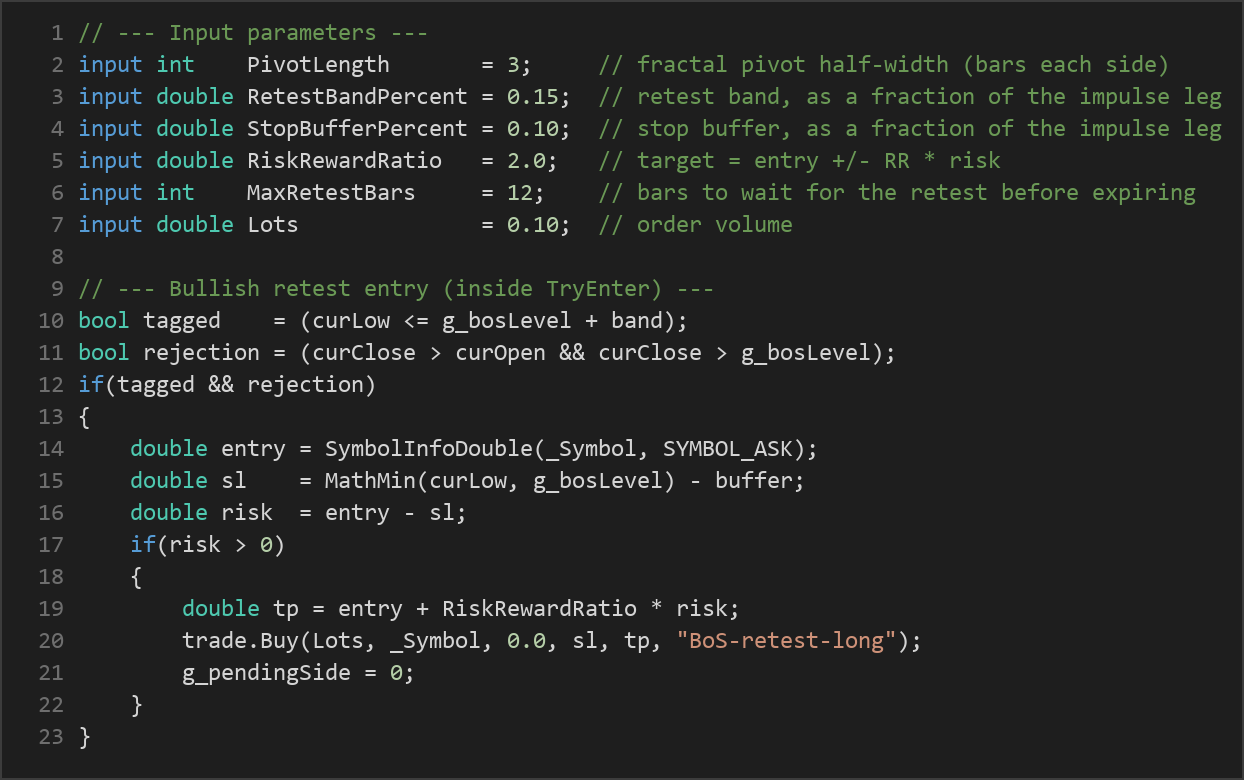
- Confirming the entry: For a long, the strategy signals an entry only when price dips back to tag the broken level (within a band) and then prints a bullish candle that closes back above it — a rejection. For a short, it waits for a tag of the level from below and a bearish rejection candle closing back beneath it.
- Stop-loss logic: The stop is placed just beyond the retest swing extreme — below the candle low (or the level itself) for longs, above the high for shorts — and is buffered by a fraction of the impulse leg so normal noise does not clip it.
- Take-profit logic: The target is a fixed risk-to-reward multiple of the measured stop distance. With the default
RiskRewardRatioof 2.0, the take-profit sits twice as far from entry as the stop. - Invalidation: A pending setup is discarded if price closes back through the impulse origin (the move was not genuine continuation) or if the retest never arrives within
MaxRetestBars. This keeps stale setups from triggering long after the structure context has expired.
Once a position is open, the EA steps back and lets the broker-side stop-loss and take-profit manage the exit. It holds only one position per symbol at a time.
Strategy Parameters
| Parameter | Default | Min | Max | Description |
|---|---|---|---|---|
| PivotLength | 3 | 2 | 6 | Fractal pivot half-width — how many bars must sit on each side of a swing high/low for it to count as a confirmed pivot. Larger values mark fewer, more significant swings. |
| RetestBandPercent | 0.15 | 0.02 | 0.50 | Width of the retest acceptance zone, expressed as a fraction of the impulse leg. A larger band tolerates a looser, shallower pullback before confirming. |
| StopBufferPercent | 0.10 | 0.00 | 0.50 | Extra padding placed beyond the swing extreme for the stop-loss, as a fraction of the impulse leg. Higher values give the trade more breathing room at the cost of a wider risk. |
| RiskRewardRatio | 2.0 | 1.0 | 4.0 | The target distance as a multiple of the stop distance. A value of 2.0 sets the take-profit twice as far as the stop. |
| MaxRetestBars | 12 | 3 | 40 | How many bars the strategy will wait for the retest to arrive before expiring the setup and standing down. |
| Lots | 0.10 | 0.01 | 1.0 | The fixed order volume in lots for each trade. Should be aligned with your account size and risk tolerance. |
Recommended Chart Settings
The Break Of Structure Retest strategy was designed to run on a single primary timeframe using raw price action, which makes it adaptable across instruments. A common starting point for studying structure-based continuation is a liquid major forex pair such as EUR/USD on an intraday timeframe like the 15-minute (M15) or 1-hour (H1) chart, where impulsive legs and clean retests appear regularly. The H1 chart in particular tends to produce more deliberate, well-defined swings that are easier to study.
Because the strategy reads only structure, it can be applied to other symbols and timeframes for experimentation. Keep in mind that results will vary considerably across different market conditions, instruments, and broker feeds — a setting that maps structure cleanly on one pair may behave very differently on another. Always test any combination on a demo account before drawing conclusions.
How to Install on MetaTrader 5
- Download the .ex5 file from the link below
- Copy it to your MT5
MQL5\Expertsfolder - Restart MetaTrader 5 or refresh the Navigator panel
- Drag the EA onto a chart matching the recommended symbol and timeframe
- Configure the input parameters and enable Algo Trading
What to Consider Before Using This EA
Every strategy has a personality, and understanding this one's strengths and weaknesses is the most valuable part of studying it.
Strengths. The logic is transparent and rules-based — there is no curve-fit indicator stack to second-guess, and signals are evaluated only on closed bars, so they do not repaint. The break-then-retest sequence is a disciplined way to join a trend with a defined, relatively tight stop, which historically gives this style of entry a favourable risk-to-reward geometry. The built-in invalidation logic also forces setups to expire rather than lingering indefinitely.
Limitations. Like all continuation systems, this strategy depends on the market actually trending. In ranging, low-momentum conditions, breaks of structure frequently turn into false breaks, and the retest entry can place you into a reversal. Because it waits for a clean pullback, it will also miss strong moves that break out and never look back — the retest simply never arrives, and the setup expires. Fractal pivots are confirmed only after PivotLength bars have closed on each side, which introduces an inherent lag in recognising the most recent structure. Finally, the fixed lot size and fixed risk-to-reward target do not adapt to volatility, so the same settings may behave very differently across calm and turbulent sessions.
Where it may underperform. Choppy consolidations, major news spikes, and low-liquidity sessions are the classic environments where structure-based breaks become unreliable. Treat these as the conditions to watch and study rather than as guaranteed losers — observing why the strategy struggles there is what builds genuine market intuition.
Risk Management Tips
Sound risk management matters far more than any single entry signal. As you study this strategy, keep these general principles in mind:
- Risk a small, fixed fraction per trade. A widely taught guideline is to risk no more than 1–2% of your account on any single position. Because this EA uses a fixed
Lotsvalue, you may need to adjust that volume so the distance to your stop represents only a small slice of your balance. - Understand your drawdown tolerance. Even a well-structured strategy will experience losing streaks. Know in advance how large a peak-to-trough decline you are prepared to sit through before you would step back and re-evaluate.
- Start on a demo account. Run the EA in a simulated environment first to observe its behaviour across different sessions and market conditions before risking any real capital.
- Size positions deliberately. Match your lot size to your account equity and the instrument's volatility rather than using a default value blindly.
- Review, don't set-and-forget. Markets evolve; periodically review how the strategy is performing and whether the chosen parameters still suit current conditions.
Risk Warning
Trading foreign exchange, CFDs, and other leveraged financial instruments involves substantial risk of loss and is not suitable for all investors. The strategies and tools discussed on this page are provided for educational purposes only and do not constitute financial advice, investment recommendations, or solicitation to trade. Always consult a qualified financial adviser before making trading decisions. Past backtest performance is not indicative of future results.
Downloads
- Expert Advisor: BreakOfStructureRetest.ex5 (2 downloads)
- Source Code: BreakOfStructureRetest.mq5 (0 downloads)
- Documentation: BreakOfStructureRetest.pdf (1 downloads)