Disclaimer: This article is for educational and informational purposes only. It does not constitute financial or investment advice. Trading forex and CFDs carries significant risk of loss. Past performance of any strategy — including backtests — does not guarantee future results. Never trade with money you cannot afford to lose.
What Is This Strategy?
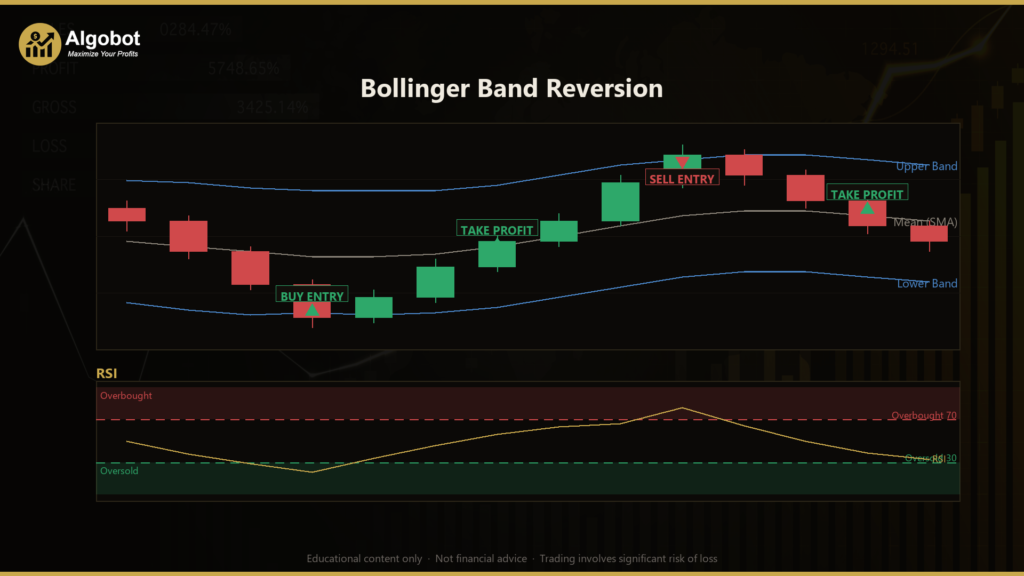
Bollinger Band Reversion is a mean-reversion trading strategy built around two well-known technical indicators: Bollinger Bands (a moving-average "envelope" plotted a set number of standard deviations above and below price) and the Relative Strength Index (RSI), a momentum oscillator that measures whether recent moves have been overextended. The core idea is simple to describe: price tends to spend most of its time near its statistical average, and large pushes far outside that average are frequently followed by a pullback toward it.
This strategy is designed for ranging or range-bound market conditions — periods when an instrument oscillates within a relatively stable zone rather than trending strongly in one direction. When a candle closes beyond one of the outer bands and RSI agrees that the move looks exhausted, the strategy "fades" the extreme, betting that price will drift back toward the central moving average. That moving average becomes the take-profit target, while an Average True Range (ATR) based stop sits beyond the band to limit damage if the move turns out to be a genuine breakout instead of a reversion.
As a learning tool, Bollinger Band Reversion is well suited to traders who want to study how volatility envelopes, momentum confirmation, and volatility-scaled risk fit together in a single rules-based system. It is not a profit opportunity or a shortcut — it is a structured example of a classic counter-trend approach that you can dissect, backtest, and adapt. Beginners can use it to understand why mean-reversion systems work in some environments and struggle in others, while more experienced students can experiment with its parameters to see how sensitivity changes behaviour.
How It Works
The strategy evaluates its rules once per closed bar, so signals are based on completed candles rather than the noisy, still-forming current bar. On each new bar it recalculates the Bollinger Bands, RSI, and ATR, then checks for a setup. Here is what happens, step by step:
- Building the envelope: The strategy computes a Simple Moving Average (SMA) of recent closing prices — the "mean" — and then adds and subtracts a multiple of the price's standard deviation to form an upper band and a lower band. Wider price swings push the bands apart; quiet markets pull them in.
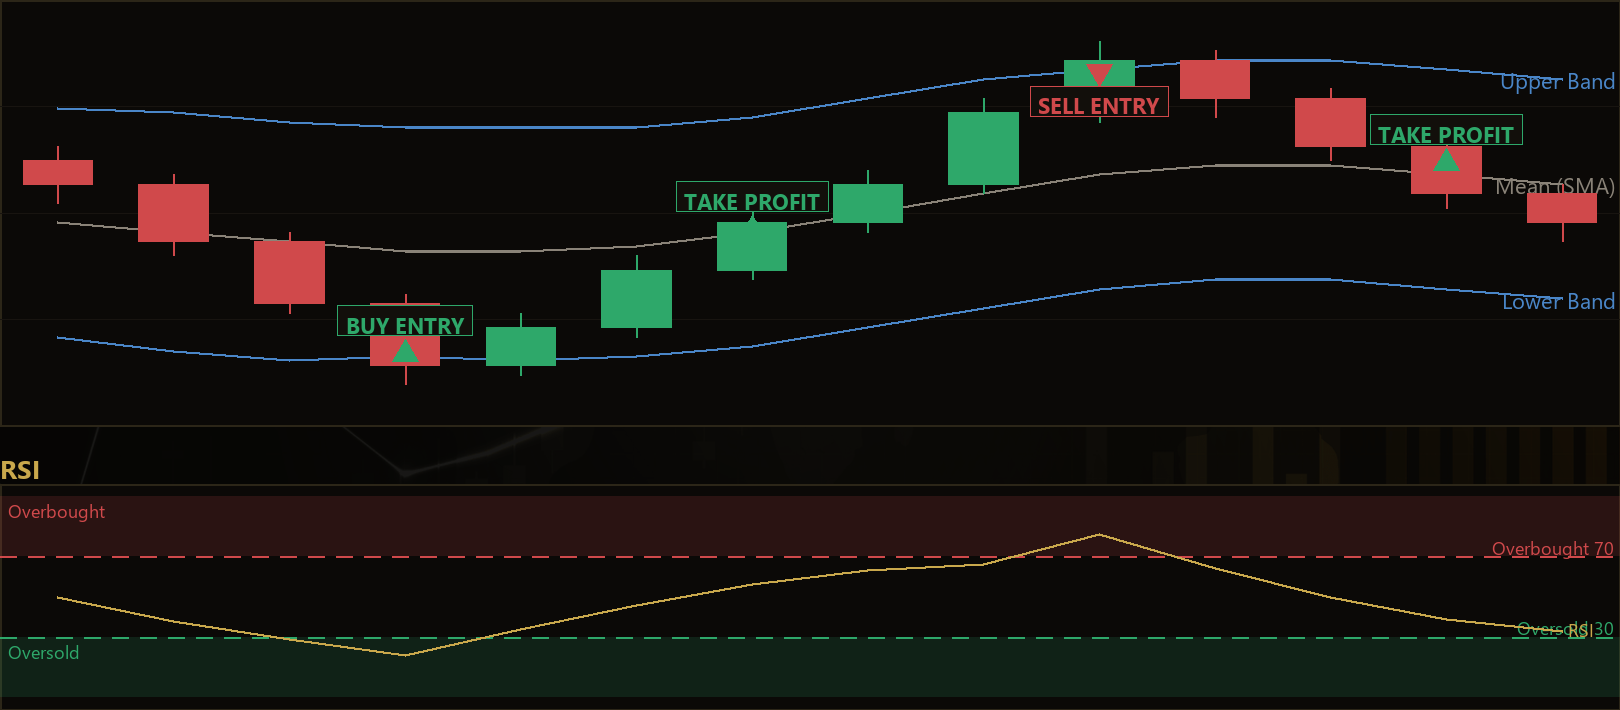
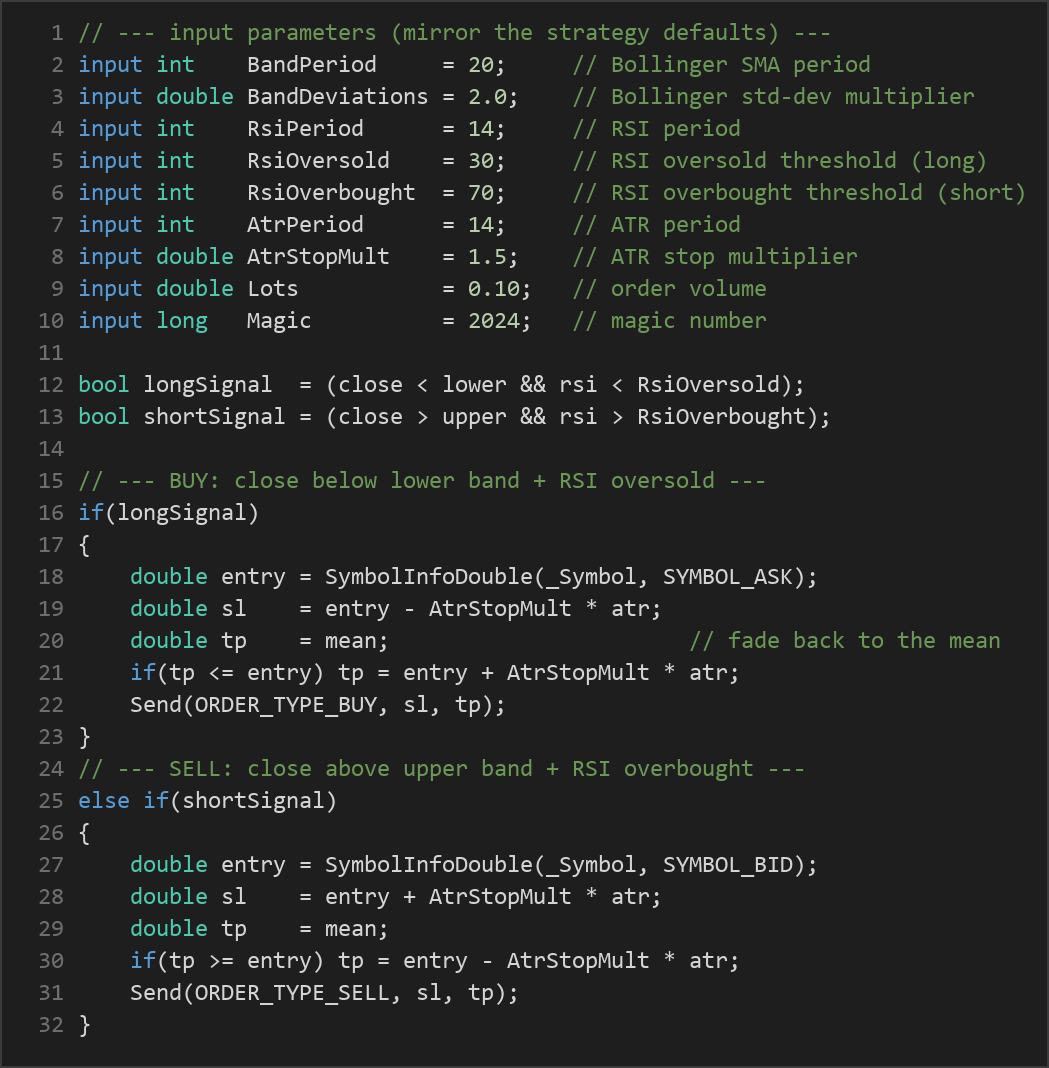
- Long (buy) signal: The strategy signals a long entry when the most recently closed bar closes below the lower band and RSI is below the oversold threshold (default 30). Both conditions must agree — the price extreme alone is not enough; momentum must also indicate the down-move may be exhausted.
- Short (sell) signal: The strategy signals a short entry when the closed bar closes above the upper band and RSI is above the overbought threshold (default 70). Again, both the band breach and momentum exhaustion are required.
- Take-profit logic: The profit target is the moving-average mean in the centre of the bands. The strategy is explicitly fading the extreme back toward the average, so the central line is the natural exit. If the mean happens to sit on the wrong side of the entry price (which can occur in fast markets), the target falls back to a distance equal to the ATR stop multiple, so the trade always has a sensible target.
- Stop-loss logic: The stop is placed beyond the band using ATR, a measure of recent volatility. For a long, the stop sits one
AtrStopMultmultiple of ATR below the entry; for a short, the same distance above. Because ATR expands in volatile conditions and contracts in calm ones, the stop automatically adapts to current market activity. - One position at a time: The strategy holds only a single open position per magic number on the symbol. It will not stack or pyramid entries, which keeps exposure predictable.
- Breakout protection: Mean-reversion's weakness is the rare moment a band breach becomes a real breakout. The ATR stop is the strategy's defence — it cuts the trade quickly when price keeps running instead of reverting.
Strategy Parameters
| Parameter | Default | Min | Max | Description |
|---|---|---|---|---|
| BandPeriod | 20 | 10 | 50 | Number of bars in the Bollinger Bands moving average. Higher values give a smoother, slower-reacting mean. |
| BandDeviations | 2.0 | 1.0 | 3.0 | How many standard deviations the outer bands sit from the mean. Larger values require more extreme closes before a signal. |
| RsiPeriod | 14 | 5 | 30 | Look-back length for the RSI momentum oscillator. Shorter periods make RSI more sensitive. |
| RsiOversold | 30 | 10 | 40 | RSI level below which the market is treated as oversold, helping confirm long entries. |
| RsiOverbought | 70 | 60 | 90 | RSI level above which the market is treated as overbought, helping confirm short entries. |
| AtrPeriod | 14 | 5 | 30 | Look-back length for ATR, which measures recent volatility for stop placement. |
| AtrStopMult | 1.5 | 0.5 | 4.0 | Multiplier applied to ATR to set the stop-loss distance. Larger values give wider stops. |
| Lots | 0.10 | 0.01 | 1.0 | Order volume (position size) in lots for each trade. |
Recommended Chart Settings
Bollinger Band Reversion is a single-timeframe, indicator-based strategy that runs on whatever timeframe you attach it to — every calculation uses the chart's primary timeframe. As a starting point for study, many mean-reversion approaches are explored on liquid major forex pairs (for example EUR/USD) using intraday charts such as the M15, M30, or H1 timeframe, where ranging behaviour is common. The defaults (a 20-period band with 2.0 standard deviations, RSI 14, ATR 14) reflect classic Bollinger Band settings.
Keep in mind that results will vary significantly across different symbols, timeframes, and market conditions. A configuration that behaves well on one instrument during a ranging phase may perform very differently during a strong trend or on a more volatile pair. Always test any settings on historical data and a demo account before drawing conclusions.
How to Install on MetaTrader 5
- Download the .ex5 file from the link below
- Copy it to your MT5
MQL5\Expertsfolder - Restart MetaTrader 5 or refresh the Navigator panel
- Drag the EA onto a chart matching the recommended symbol and timeframe
- Configure the input parameters and enable Algo Trading
What to Consider Before Using This EA
Every strategy has a personality, and understanding Bollinger Band Reversion's trade-offs is part of learning from it.
Strengths. The approach is intuitive and transparent — each entry requires both a price extreme and momentum confirmation, which filters out some weak signals that a band breach alone would produce. The use of ATR for the stop means risk distance scales with current volatility rather than being a fixed, arbitrary number. The take-profit at the mean gives the strategy a clear, logically consistent exit.
Known limitations. Mean-reversion systems are, by design, counter-trend. Their classic failure mode is a sustained breakout: price closes outside a band, the strategy fades it, and the market simply keeps going. Because the stop sits just beyond the band, a strong trend can trigger a sequence of stop-outs. RSI confirmation reduces but does not eliminate this risk.
Where it may underperform. Strongly trending markets, high-impact news events, and low-liquidity sessions can all produce the kind of one-directional moves that punish reversion logic. The strategy also takes only one position at a time, so it may sit idle through extended periods that lack a qualifying signal. None of this makes the approach "good" or "bad" — it simply means the environment matters a great deal, which is exactly why studying it on historical data is valuable.
Risk Management Tips
Risk management is the part of trading you can actually control, and it deserves more attention than any entry signal. A few general principles to study and apply:
- Position sizing: Choose a lot size appropriate to your account, not the maximum your broker allows. The
Lotsparameter directly controls exposure on every trade. - Limit risk per trade: A widely taught guideline is to risk no more than 1–2% of account equity on any single position, so that a string of losing trades does not threaten the account.
- Use a demo account first: Test the strategy thoroughly in a risk-free demo environment until you understand its behaviour before considering real capital.
- Understand drawdown: Every strategy experiences losing streaks. Know how large a peak-to-trough decline you are emotionally and financially prepared to tolerate, and review backtests with that number in mind.
- Account for costs: Spreads, commissions, and slippage all affect real-world outcomes and can be especially meaningful for systems that target the relatively modest distance back to a moving average.
Risk Warning
Trading foreign exchange, CFDs, and other leveraged financial instruments involves substantial risk of loss and is not suitable for all investors. The strategies and tools discussed on this page are provided for educational purposes only and do not constitute financial advice, investment recommendations, or solicitation to trade. Always consult a qualified financial adviser before making trading decisions. Past backtest performance is not indicative of future results.
Downloads
- Expert Advisor: BollingerBandReversion.ex5 (59 downloads)
- Source Code: BollingerBandReversion.mq5 (53 downloads)
- Documentation: BollingerBandReversion.pdf (65 downloads)