Disclaimer: This article is for educational and informational purposes only. It does not constitute financial or investment advice. Trading forex and CFDs carries significant risk of loss. Past performance of any strategy — including backtests — does not guarantee future results. Never trade with money you cannot afford to lose.
What Is This Strategy?
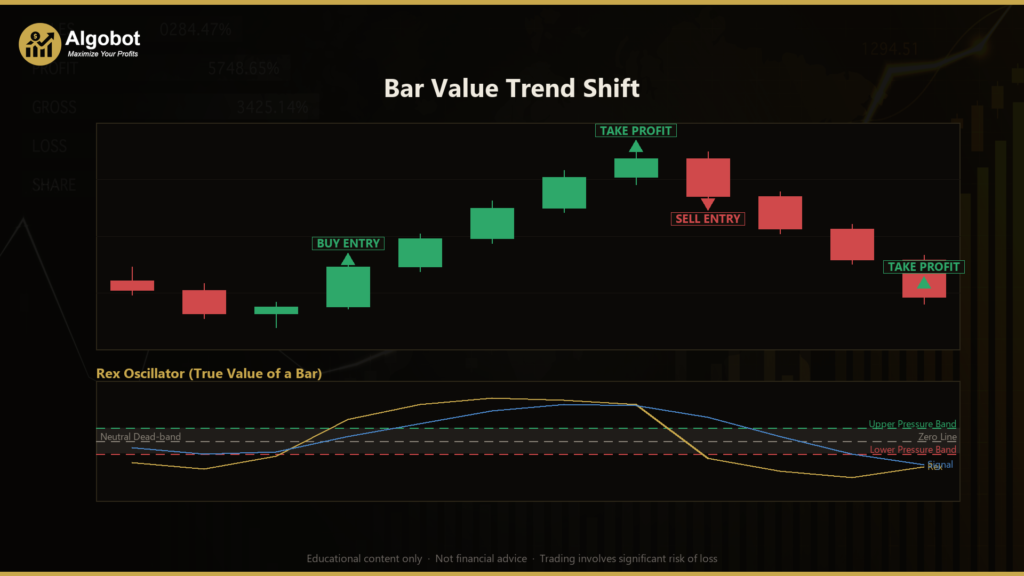
The Bar Value Trend Shift strategy is a momentum-and-pressure trading system built around the Rex Oscillator, a classic indicator introduced by Jack Hutson that measures the "True Value of a Bar" (TVB). Rather than looking only at how far price moved from open to close, this oscillator reads the entire candle — open, high, low, and close — to gauge who was really in control during each bar. The trading style here is trend-following with a crossover trigger: the strategy watches for a genuine shift in market pressure and acts on it, while filtering out weak, indecisive signals near the neutral zone.
At its core, the Rex Oscillator asks a simple question about every completed candle: did the market close near the top of its full range (bullish conviction) or near the bottom (bearish conviction)? A candle that finishes high in its range, above its open, with only a small upper wick, generates a strongly positive reading. A candle that collapses to close near its low produces a strongly negative reading. Balanced or "doji" bars — where buyers and sellers fought to a draw — sit close to zero. By folding rejection tails (the upper and lower wicks) into the calculation, the indicator captures information that body-only pressure gauges ignore.
This strategy is best suited as a learning tool for traders who want to understand how full-OHLC pressure analysis differs from simple close-based momentum, and how a fast/slow oscillator crossover can be filtered with volatility to reduce noise. It is designed to identify markets that are beginning to trend with one-sided conviction, and it deliberately stays out of choppy, directionless conditions. It is not a shortcut or a promise — it is a structured framework for studying how trend shifts can be detected and traded systematically.
How It Works
The strategy processes one completed bar at a time and builds a two-layer oscillator before checking for a trade. Here is the full logic in plain English:
- Measuring bar pressure (TVB): For each finished candle, the strategy calculates
TVB = 3 × Close − (High + Low + Open). This "True Value of a Bar" is strongly positive when the close finishes near the top of the whole range and strongly negative when it finishes near the bottom. - The Rex line (pressure): The raw TVB readings are smoothed with a Simple Moving Average (SMA — an average of the last N values) over the RexPeriod. This produces the main pressure line, filtering out single-bar noise.
- The Signal line (baseline): The Rex line is smoothed again with an SMA over the SignalPeriod, creating a slower baseline that the pressure line is compared against.
- The volatility filter (ATR): The strategy calculates the Average True Range (ATR — a measure of typical bar-to-bar volatility) and multiplies it by PressureAtrFraction to create a "dead-band" threshold around zero. This ensures the strategy only reacts when pressure is genuinely one-sided.
Entry conditions (the strategy signals a trade only when both parts are true):
- Long signal: The Rex line crosses above the Signal line and the Rex line is above the positive threshold (
+thr). This indicates a fresh upward pressure shift with buyers clearly in control — not just a marginal crossover hovering at the zero line. - Short signal: The Rex line crosses below the Signal line and the Rex line is below the negative threshold (
−thr). This indicates a fresh downward pressure shift with sellers in control.
Exit conditions:
- Stop-loss: When a position is opened, a protective stop is placed at a distance of AtrSlMult × ATR away from the entry price. Wider volatility means a wider stop, so the exit adapts to current market conditions.
- Take-profit: A target is placed at AtrTpMult × ATR away from entry, again scaled to volatility.
- Stop-and-reverse: If the strategy is already in a long position and a short signal fires (or vice versa), it closes the existing trade and opens a new one in the opposite direction. This keeps the strategy aligned with the most recent pressure shift.
Because entries fire only on completed bars and require a real crossover plus a volatility-cleared threshold, the strategy aims to avoid the constant whipsaw that pure zero-line oscillators can suffer from.

Strategy Parameters
| Parameter | Default | Min | Max | Description |
|---|---|---|---|---|
| RexPeriod | 8 | 3 | 40 | Number of bars used to smooth the raw True-Value-of-a-Bar pressure into the Rex line. Lower values react faster; higher values are smoother. |
| SignalPeriod | 5 | 2 | 25 | Number of Rex values averaged to form the slower signal baseline that the pressure line crosses. |
| PressureAtrFraction | 0.10 | 0.0 | 1.0 | Zero-line dead-band. The Rex line must clear this fraction of ATR before a crossover counts as a valid signal. Higher values filter more aggressively. |
| AtrPeriod | 14 | 5 | 40 | Lookback length for the Average True Range, used both for the threshold and for stop/target sizing. |
| AtrSlMult | 2.0 | 0.5 | 6.0 | Stop-loss distance expressed as a multiple of ATR. |
| AtrTpMult | 3.0 | 0.5 | 10.0 | Take-profit distance expressed as a multiple of ATR. |
| Lots | 0.10 | 0.01 | 1.0 | Fixed position size in lots for each trade. |

Recommended Chart Settings
The Bar Value Trend Shift EA is designed to run on a single timeframe — whatever chart you attach it to becomes its working timeframe, since every calculation uses the chart's symbol and period. For studying its behavior, many traders begin with major forex pairs such as EUR/USD or GBP/USD on the H1 (1-hour) or H4 (4-hour) timeframes, where trends tend to develop with enough follow-through for an ATR-based stop and target to make sense.
That said, the default parameters are a starting point, not an optimized configuration. The oscillator's responsiveness (RexPeriod and SignalPeriod) and the dead-band filter (PressureAtrFraction) interact strongly with the volatility of the instrument you choose. Results will vary considerably across different symbols, timeframes, and market conditions, so treat any single setting as a hypothesis to be tested rather than a finished answer.
How to Install on MetaTrader 5
- Download the .ex5 file from the link below
- Copy it to your MT5
MQL5\Expertsfolder - Restart MetaTrader 5 or refresh the Navigator panel
- Drag the EA onto a chart matching the recommended symbol and timeframe
- Configure the input parameters and enable Algo Trading
What to Consider Before Using This EA
Like every mechanical system, the Bar Value Trend Shift strategy has clear strengths and equally clear limitations that you should understand before relying on it.
Strengths. The use of the full OHLC range gives the Rex Oscillator a richer view of each bar than close-only momentum tools — it "sees" rejection wicks and where the close landed inside the range, which can help it register conviction earlier. The ATR-scaled dead-band is a thoughtful filter: it prevents the strategy from firing on trivial crossovers that occur when the market has no real direction. And because stops and targets are volatility-scaled rather than fixed, the risk framework adapts automatically as conditions change.
Limitations. Any crossover system is inherently a lagging approach — by the time the Rex line crosses its signal and clears the threshold, part of the move may already be complete. In sideways, range-bound markets, even a filtered oscillator can generate a series of losing signals as pressure flips back and forth. The stop-and-reverse logic, while keeping the strategy aligned with fresh signals, can compound losses during choppy periods by repeatedly flipping direction. The strategy also holds no more than one position at a time per symbol and uses a fixed lot size, so it does not scale exposure to conviction or account equity on its own.
Where it may underperform. Expect the weakest behavior in low-volatility consolidation, during news-driven spikes that gap through stops, and on instruments with wide spreads relative to their typical ATR. Historically, trend-following crossover systems tend to give back open profit during the transition from a trend back into a range. None of this makes the approach "bad" — it makes it a tool with a specific job. Understanding that job is the whole point of studying it.
Risk Management Tips
Sound risk management matters far more than any single indicator setting. Keep these general principles in mind as you study this strategy:
- Risk a small, fixed fraction per trade. A common educational guideline is to risk no more than 1–2% of account equity on any single position. Adjust the Lots parameter (or use proper position sizing) so that the ATR-based stop distance corresponds to that fraction — not the other way around.
- Always test on a demo account first. Run the EA in a simulated environment across many weeks and multiple market conditions before considering any live capital. This is how you learn the strategy's real-world behavior without financial consequences.
- Understand drawdown. Every strategy experiences losing streaks. Study the largest peak-to-trough decline in your testing so you know what a normal rough patch looks like, and whether you could tolerate it emotionally and financially.
- Don't over-optimize. Tuning parameters until a backtest looks perfect ("curve fitting") usually produces settings that fail on new data. Prefer robust, stable parameter zones over a single fragile peak.
- Account for costs. Spreads, commissions, and slippage all eat into an ATR-based system's results, especially on shorter timeframes. Include realistic costs in any evaluation.
Risk Warning
Trading foreign exchange, CFDs, and other leveraged financial instruments involves substantial risk of loss and is not suitable for all investors. The strategies and tools discussed on this page are provided for educational purposes only and do not constitute financial advice, investment recommendations, or solicitation to trade. Always consult a qualified financial adviser before making trading decisions. Past backtest performance is not indicative of future results.
Downloads
- Expert Advisor: BarValueTrendShift.ex5 (38 downloads)
- Source Code: BarValueTrendShift.mq5 (34 downloads)
- Documentation: BarValueTrendShift.pdf (36 downloads)