Disclaimer: This article is for educational and informational purposes only. It does not constitute financial or investment advice. Trading forex and CFDs carries significant risk of loss. Past performance of any strategy — including backtests — does not guarantee future results. Never trade with money you cannot afford to lose.
What Is This Strategy?
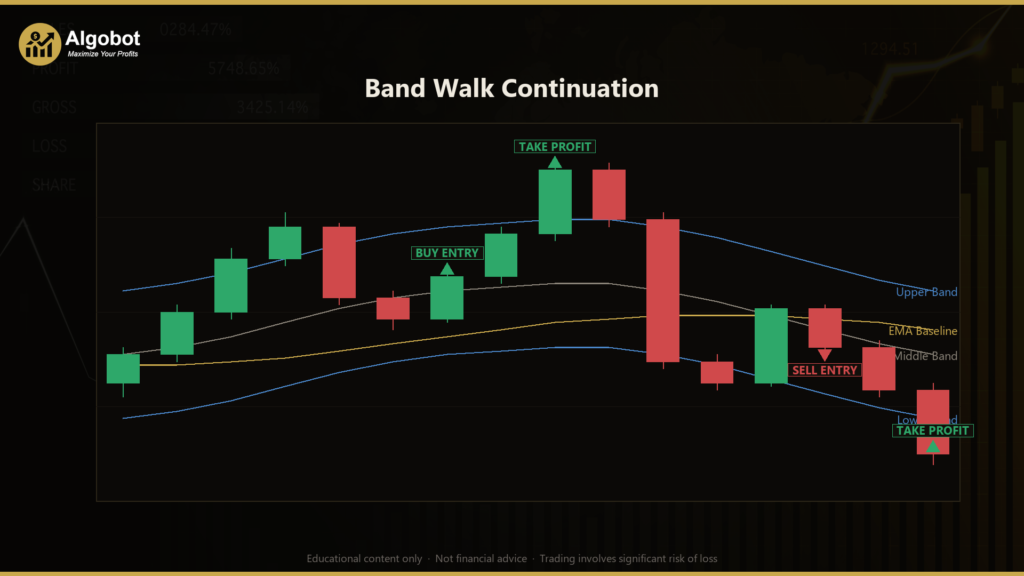
The Band Walk Continuation strategy is a trend-following system built around Bollinger Bands — a volatility indicator that plots a moving-average "middle band" with two outer rails set a number of standard deviations away. Most traders learn Bollinger Bands as a mean-reversion tool, fading price when it touches an outer rail. Band Walk Continuation deliberately takes the inverse premise: when price posts several consecutive closes beyond a rail, it is "walking the band," which is historically a hallmark of a strong, one-sided trend rather than an exhausted extreme.
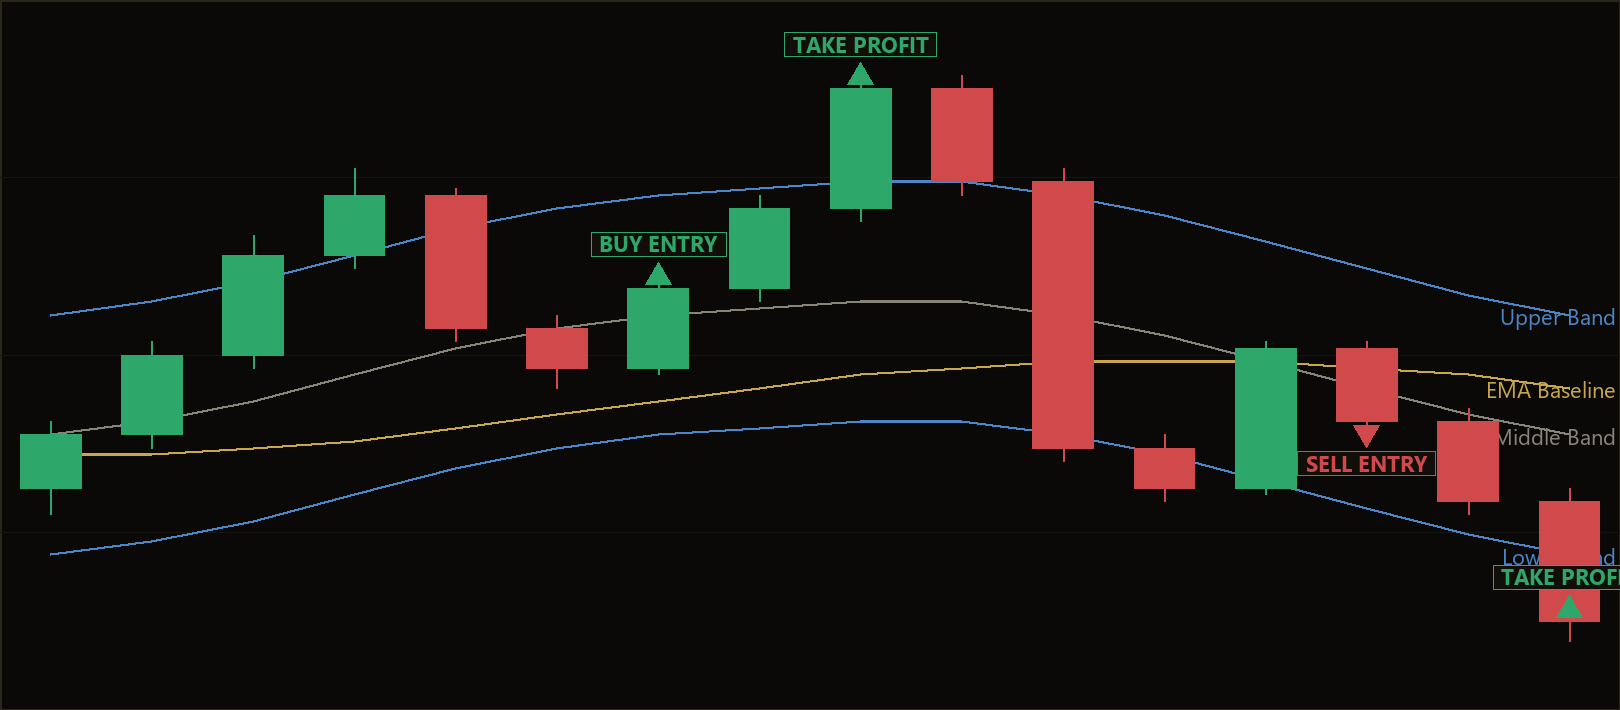
Instead of betting against that strength, this strategy respects it. After a confirmed band-walk, it waits for a shallow, healthy pullback toward the moving-average mean and then looks to re-enter with the trend the moment price resumes in the original direction. An EMA (Exponential Moving Average) baseline keeps the system on the correct side of the broader move, an ATR (Average True Range) reading sizes the stop to current volatility, and a fixed reward-to-risk ratio defines the target.
As a learning tool, Band Walk Continuation is well suited to traders who want to study trend-continuation entries and pullback timing in a structured, rule-based way. It is a single-timeframe, indicator-driven expert advisor (EA) with distinct long and short logic, making it a clear example of how a state machine can turn a discretionary "buy the dip in an uptrend" idea into fully objective, testable code. It should be viewed as a framework for study and experimentation, not a shortcut to results.
How It Works
The strategy evaluates its rules once per closed bar on the selected timeframe, so it never reacts to the noise of an unfinished candle. Each side (long and short) runs through an objective, time-boxed state machine: Idle → Walking → PulledBack → entry.
- Detecting the band-walk (Idle → Walking): The strategy counts consecutive closes beyond a Bollinger rail. Once price closes above the upper band for
WalkBarsbars in a row (or below the lower band for shorts), it marks the setup as a confirmed "walk." A strong thrust in one direction automatically cancels any setup building the opposite way. - Waiting for the pullback (Walking → PulledBack): After a walk is confirmed, the strategy watches for price to retrace to the moving-average mean — a close back through the middle band. This models the "healthy pullback" that often follows a strong leg. The setup is time-boxed by
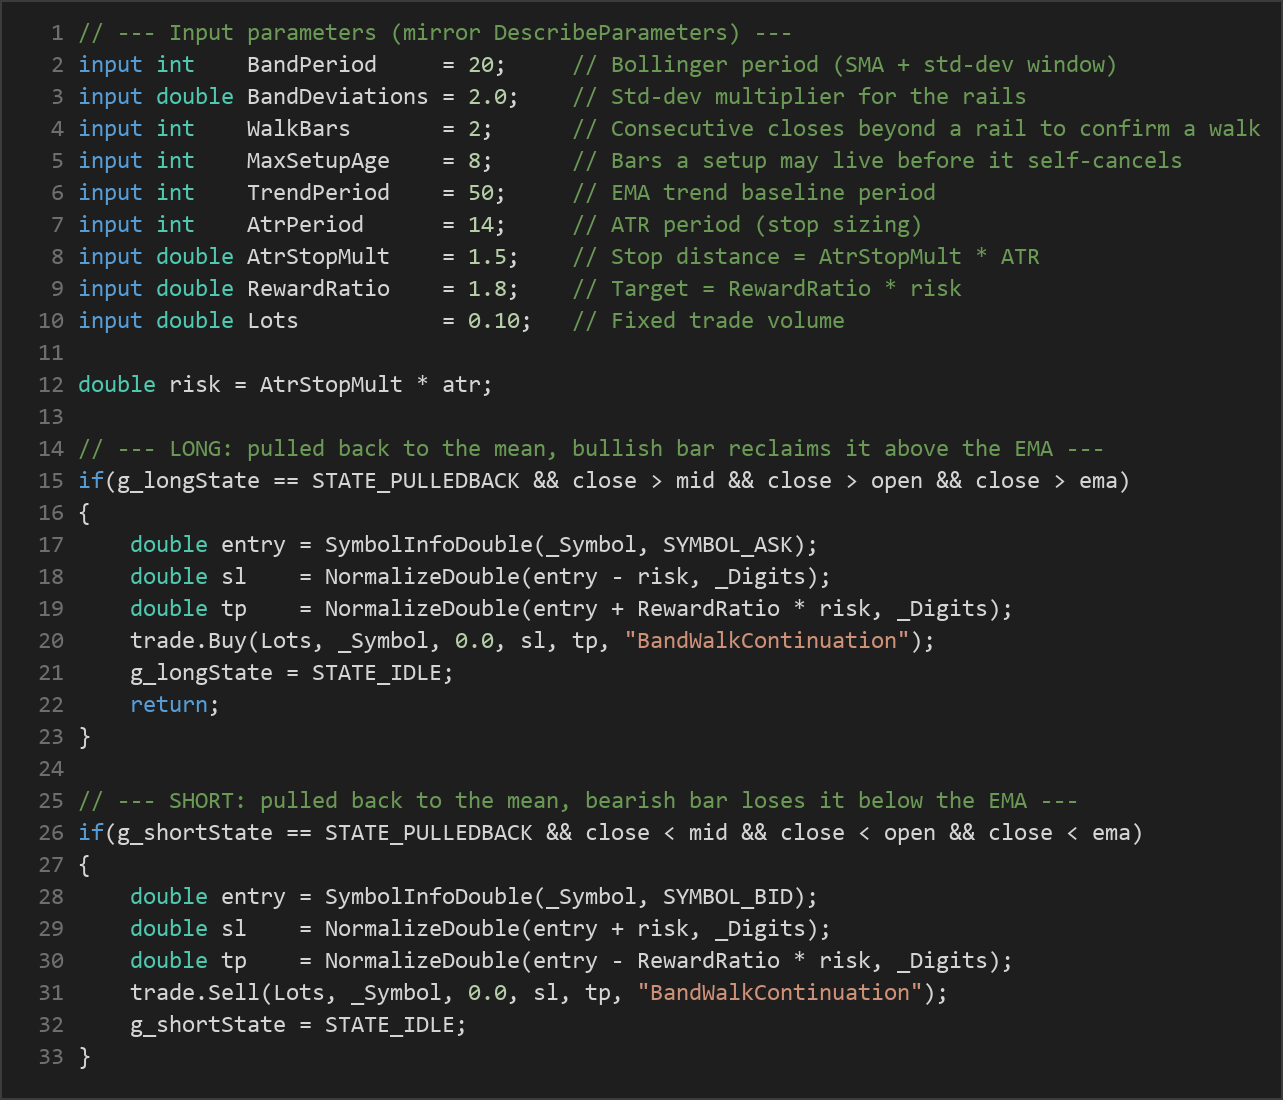
MaxSetupAge: if too many bars pass, or price breaks the opposite rail, the setup self-cancels and returns to Idle. - Long entry signal: When a long setup is in the PulledBack state, the strategy signals a buy if the freshly-closed bar closes back above the mean, closes higher than it opened (a bullish bar), and price sits above the EMA baseline. All three must align.
- Short entry signal: The mirror image. With a short setup in the PulledBack state, the strategy signals a sell if the bar closes back below the mean, closes lower than it opened (a bearish bar), and price sits below the EMA baseline.
- Stop-loss logic: The stop distance is volatility-adaptive — it equals
AtrStopMult × ATR. For a long, the stop sits that distance below the entry; for a short, that distance above. When markets are volatile the stop widens; when they are quiet it tightens. - Take-profit logic: The target is a fixed multiple of the risk taken. It is placed at
RewardRatio × (stop distance)away from entry, so the reward-to-risk relationship is defined structurally on every trade. - One position at a time: The EA holds only a single open position per magic number on the symbol. While a trade is live the state machines keep advancing in the background, but no new order is sent until the current one closes.
Because every transition is derived from indicator values on closed bars, the strategy behaves the same way in a backtest as it does live — there is no subjective judgment in any step.
Strategy Parameters
| Parameter | Default | Min | Max | Description |
|---|---|---|---|---|
| BandPeriod | 20 | 10 | 50 | Number of bars in the Bollinger Bands lookback (the SMA mean and standard-deviation window). |
| BandDeviations | 2.0 | 1.0 | 3.0 | Standard-deviation multiplier that sets how far the upper and lower rails sit from the mean. |
| WalkBars | 2 | 1 | 5 | Consecutive closes beyond a rail required to confirm a band-walk. |
| MaxSetupAge | 8 | 3 | 20 | Maximum bars a setup may live before it self-cancels back to Idle. |
| TrendPeriod | 50 | 20 | 150 | Period of the EMA trend baseline used as a directional filter. |
| AtrPeriod | 14 | 5 | 30 | Lookback for the ATR that measures current volatility for stop sizing. |
| AtrStopMult | 1.5 | 0.5 | 4.0 | Stop distance as a multiple of ATR. |
| RewardRatio | 1.8 | 1.0 | 4.0 | Take-profit distance as a multiple of the risk (stop distance). |
| Lots | 0.10 | 0.01 | 1.0 | Fixed trade volume in lots. |
Recommended Chart Settings
Band Walk Continuation is a single-timeframe strategy — every calculation is derived from the chart's own timeframe, so it runs on whatever period you attach it to. A common starting point for studying trend-continuation systems is a liquid major forex pair such as EUR/USD on an intraday-to-swing timeframe like H1 (1-hour) or H4 (4-hour), where band-walks and pullbacks tend to be cleaner and spreads are typically low.
That said, the "best" symbol and timeframe depend heavily on the character of the market you are studying. Trending instruments will produce more valid walk-and-pullback sequences than range-bound ones. Before drawing any conclusions, test the default parameters across several symbols and timeframes in the MetaTrader 5 Strategy Tester, and remember that results will vary across different market conditions and broker data feeds.
How to Install on MetaTrader 5
- Download the .ex5 file from the link below
- Copy it to your MT5
MQL5\Expertsfolder - Restart MetaTrader 5 or refresh the Navigator panel
- Drag the EA onto a chart matching the recommended symbol and timeframe
- Configure the input parameters and enable Algo Trading
What to Consider Before Using This EA
Strengths of the approach. Trend-continuation entries after a pullback are a well-studied concept: they aim to join an established move at a lower-risk point rather than chasing an extended candle. The design has several disciplined features — an EMA filter to avoid trading against the broader direction, an ATR-based stop that adapts to volatility instead of using a fixed pip value, and a time-boxed state machine so stale setups automatically expire. The fixed reward-to-risk target also enforces a consistent trade structure.
Known limitations. Like all Bollinger-based systems, this one depends on the market actually trending. In choppy, sideways conditions, price can repeatedly poke the rails without producing a genuine walk, or a walk may fizzle into a range — leading to setups that cancel or entries that stall. The requirement for a confirmed walk and a clean pullback and an EMA-aligned reclaim means the strategy is selective; it may sit idle for long stretches, and some strong trends will run away before offering the pullback it waits for. Because it acts only on closed bars, entries are deliberately delayed relative to the raw price move, which is a trade-off between reliability and immediacy.
Where it may underperform. Expect weaker behavior during low-volatility ranging periods, around major news spikes that whipsaw the bands, and on very short timeframes where noise dominates. No indicator combination anticipates trend reversals, so a band-walk that abruptly fails can still produce a losing trade even when every rule was met. Treat this EA as a structured way to study trend-continuation logic — not as a finished, hands-off system.
Risk Management Tips
Sound risk management matters more than any single entry rule. Consider these general principles as you study the strategy:
- Risk a small, fixed fraction per trade. Many educational sources suggest never risking more than 1–2% of account equity on any single position. Set your
Lotsso that the ATR-based stop distance corresponds to that fraction, rather than choosing a lot size arbitrarily. - Test on a demo account first. Run the EA on a demo or in the Strategy Tester across varied market conditions before ever considering live capital. This helps you understand how often it trades and how it behaves in ranges versus trends.
- Understand drawdown. Every strategy experiences losing streaks. Study the maximum drawdown in your tests and ask whether you could tolerate that decline — both financially and psychologically — before it recovers.
- Account for costs. Spreads, commissions, and slippage all erode results, especially on lower timeframes. Include realistic costs in any evaluation.
- Keep parameters honest. Over-optimizing the inputs to fit historical data ("curve fitting") often produces settings that fail going forward. Favor robust, stable parameter ranges over perfect-looking backtests.
Risk Warning
Trading foreign exchange, CFDs, and other leveraged financial instruments involves substantial risk of loss and is not suitable for all investors. The strategies and tools discussed on this page are provided for educational purposes only and do not constitute financial advice, investment recommendations, or solicitation to trade. Always consult a qualified financial adviser before making trading decisions. Past backtest performance is not indicative of future results.
Downloads
- Expert Advisor: BandWalkContinuation.ex5 (71 downloads)
- Source Code: BandWalkContinuation.mq5 (65 downloads)
- Documentation: BandWalkContinuation.pdf (69 downloads)