Disclaimer: This article is for educational and informational purposes only. It does not constitute financial or investment advice. Trading forex and CFDs carries significant risk of loss. Past performance of any strategy — including backtests — does not guarantee future results. Never trade with money you cannot afford to lose.
What Is This Strategy?
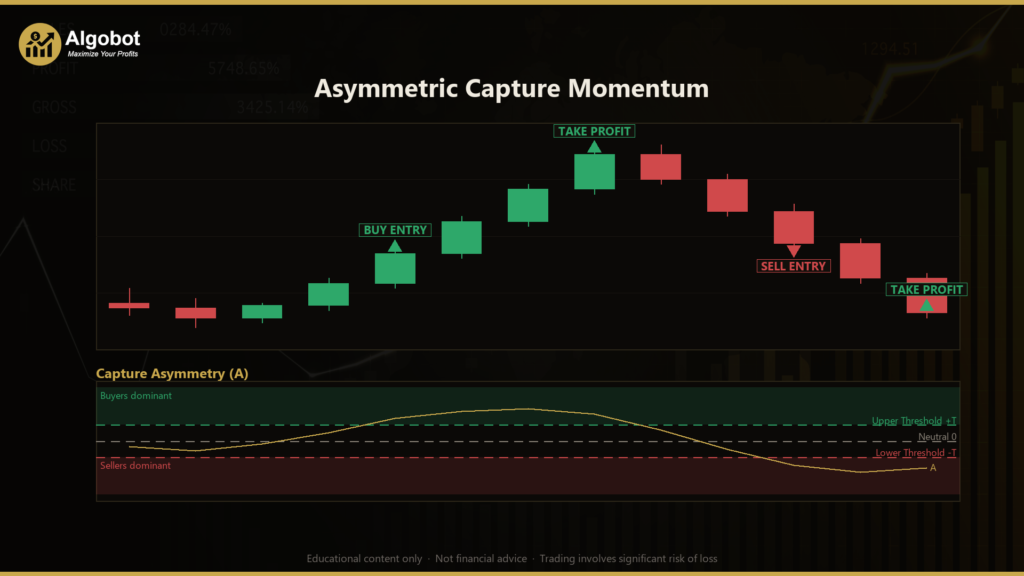
Asymmetric Capture Momentum is an MT5 Expert Advisor built around a custom capture-asymmetry momentum indicator and a self-adapting, trend-following trading style. Instead of leaning on moving averages, chart patterns, or classic oscillators, it studies the raw stream of bar-to-bar percentage returns and separates them into two groups: up-steps and down-steps. The core idea is that in a genuinely directional market, the side "in control" does not simply post more bars — it advances price in larger bursts, while the opposing side only nibbles the move back in small increments.
To measure this, the strategy compares the average magnitude of up-returns against the average magnitude of down-returns and condenses that comparison into a single number called capture asymmetry (labelled A), which always sits between −1 and +1. A strongly positive A suggests buyers are the aggressors and may indicate continuation to the upside; a strongly negative A suggests sellers are dominant. When the two magnitudes roughly equalise, A hovers near zero, which the strategy interprets as a market with no clear edge — in other words, chop.
As a learning tool, Asymmetric Capture Momentum is designed for traders who want to understand how directional conviction can be quantified from price returns alone, without traditional indicators. It is best suited to trending or momentum-driven conditions and is intended for study, backtesting, and demo experimentation rather than as a shortcut to results.
How It Works
The EA acts once per completed bar — it ignores intrabar noise and only evaluates a signal when a fresh candle closes. Here is the logic in plain English:
- Building the return stream: After each bar closes, the strategy records the relative return
r = (Close − PreviousClose) / PreviousClose. It keeps a rolling window of these returns for analysis. - Splitting the populations: Over the most recent
Windowreturns, it sums and averages the positive returns to get G+ (average up-step magnitude) and the absolute value of negative returns to get G− (average down-step magnitude). - Computing capture asymmetry: It calculates
A = (G+ − G−) / (G+ + G−). This normalised ratio expresses which side is advancing price more forcefully, on a clean −1 to +1 scale. - Self-adapting threshold: Rather than using a fixed trigger, the strategy sets
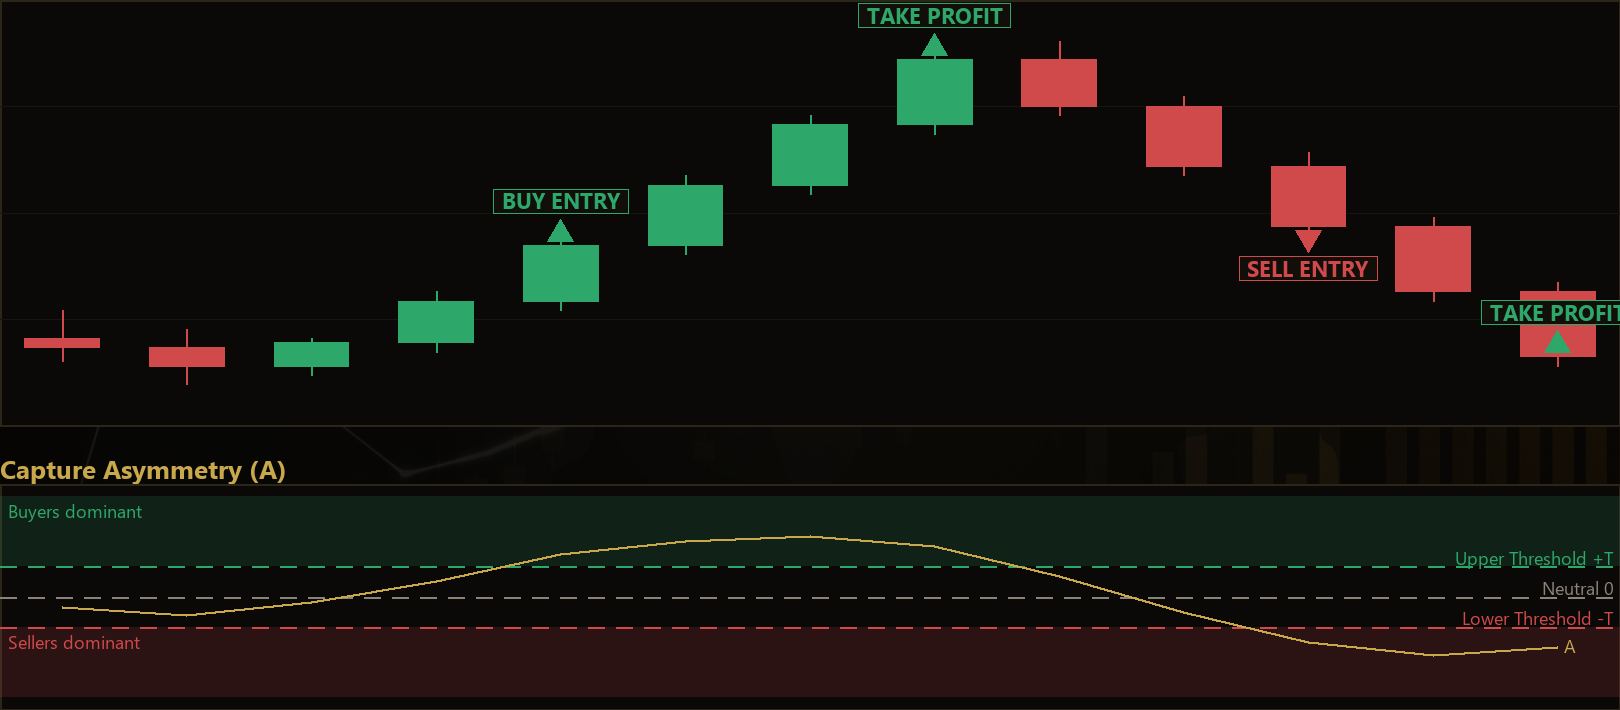
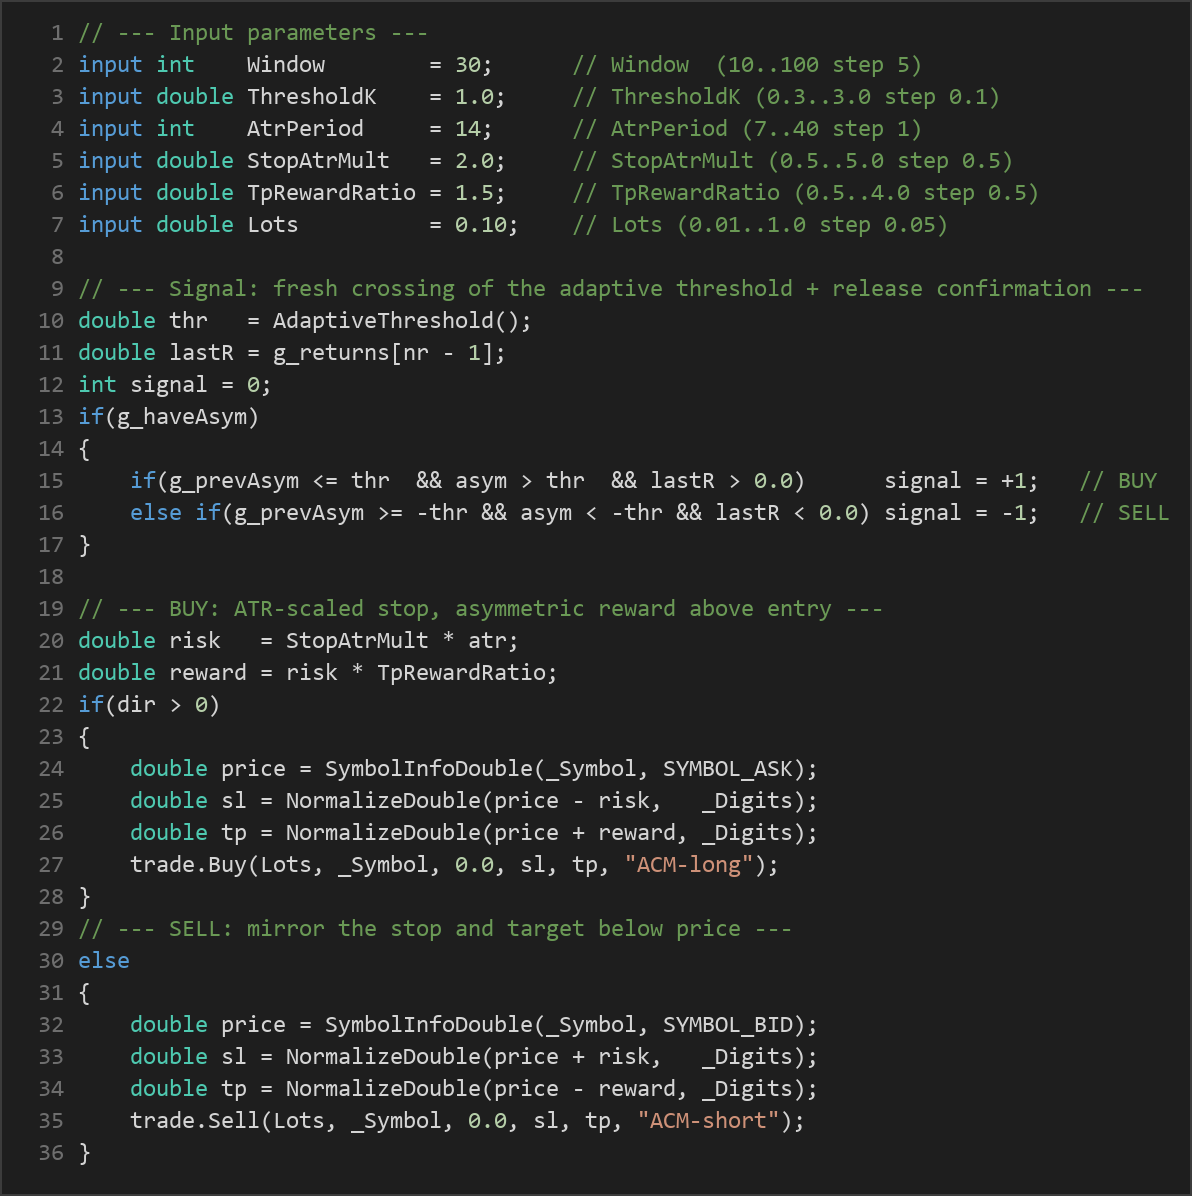
T = ThresholdK × standard deviation of recent A values. When the asymmetry series is noisy, it demands more conviction before acting; when calm, it reacts to smaller moves. The threshold is clamped to a sensible band (roughly 0.05 to 0.90). - Entry signal (long): The strategy signals a potential buy when A makes a fresh crossing above +T and the most recent return is also positive — a "release confirmation" that price is currently agreeing with the asymmetry reading.
- Entry signal (short): Symmetrically, it signals a potential sell when A makes a fresh crossing below −T and the most recent return is negative.
- Flipping positions: If a new signal opposes an existing position, the strategy closes the current trade first, then opens a fresh position in the new direction. It only enters when otherwise flat, avoiding stacked trades.
- Stop-loss logic: Risk is fully dynamic and volatility-scaled. The stop distance is
StopAtrMult × ATR, where ATR (Average True Range, a common volatility measure) is computed with a self-contained mean-of-true-range calculation. Wider volatility means a wider stop. - Take-profit logic: The target uses an asymmetric reward multiple:
Take-Profit distance = Stop distance × TpRewardRatio. With the defaults, a 2.0× ATR stop pairs with a 1.5× reward target.
Because both the trigger and the risk envelope adapt to the market's own volatility, the behaviour of the EA changes automatically as conditions shift between calm and turbulent.
Strategy Parameters
| Parameter | Default | Min | Max | Description |
|---|---|---|---|---|
| Window | 30 | 10 | 100 | Number of recent bar returns used to measure up-step vs. down-step average magnitude. Larger values smooth the asymmetry reading; smaller values react faster. |
| ThresholdK | 1.0 | 0.3 | 3.0 | Multiplier applied to the standard deviation of recent asymmetry values to set the adaptive entry threshold. Higher values demand stronger conviction before signalling. |
| AtrPeriod | 14 | 7 | 40 | Number of bars used in the Average True Range volatility calculation that scales the stop-loss and take-profit. |
| StopAtrMult | 2.0 | 0.5 | 5.0 | Multiplier on ATR that sets the stop-loss distance. Larger values give the trade more room but increase risk per trade. |
| TpRewardRatio | 1.5 | 0.5 | 4.0 | Reward-to-risk multiple. The take-profit distance equals the stop distance multiplied by this value. |
| Lots | 0.10 | 0.01 | 1.0 | Fixed trade volume in lots for each position opened by the EA. |
Recommended Chart Settings
Asymmetric Capture Momentum operates on a single symbol and single timeframe — the chart it is attached to. Because it derives everything from percentage returns, it is not tied to any one instrument, but momentum-driven markets such as major forex pairs (for example EUR/USD or GBP/USD) on intraday-to-swing timeframes like H1 or H4 are natural starting points for study, giving the Window of returns enough meaningful movement to analyse.
There is no universally "correct" setting. Results will vary considerably across different symbols, timeframes, and market conditions, so treat any configuration as a hypothesis to be tested rather than a fixed recommendation. Always validate a chosen combination in the MT5 Strategy Tester and on a demo account before drawing conclusions.
How to Install on MetaTrader 5
- Download the .ex5 file from the link below
- Copy it to your MT5
MQL5\Expertsfolder - Restart MetaTrader 5 or refresh the Navigator panel
- Drag the EA onto a chart matching the recommended symbol and timeframe
- Configure the input parameters and enable Algo Trading
What to Consider Before Using This EA
Every approach has strengths and blind spots, and an honest view helps you learn faster.
Strengths of this approach:
- It measures directional conviction from a genuinely different angle — average return magnitude rather than net change, bar counts, or gain/loss sums — which can offer a fresh perspective on momentum.
- The adaptive threshold means the strategy self-calibrates to changing volatility instead of relying on a single hard-coded trigger.
- Risk is defined on every trade through ATR-scaled stops, and the reward multiple is explicit and configurable.
Known limitations:
- Like most momentum and trend-following logic, the strategy can struggle in ranging or choppy markets, where asymmetry readings hover near zero and any crossings may produce whipsaw entries.
- The "flip on opposite signal" behaviour can lead to frequent reversals during indecisive periods, which may increase trading costs from spread and commission.
- It uses a fixed lot size, so position risk in account-currency terms grows or shrinks only with volatility-based stop distance, not with account equity.
- Sharp gaps, low-liquidity sessions, and news spikes can distort the return stream and the ATR, affecting both signals and stop placement.
The EA is a study tool for understanding return-based momentum, not a finished trading system. Expect to spend time observing when it performs as intended and, just as importantly, when it does not.
Risk Management Tips
Sound risk management matters more than any single indicator. Keep these general principles in mind:
- Size positions deliberately. A common educational guideline is to risk no more than 1–2% of account equity per trade. Adjust
LotsandStopAtrMultso that a stop-out stays within that limit for your account size. - Start on a demo account. Test the EA in simulation until you understand its behaviour across different conditions before considering any live capital.
- Understand drawdown. Even a well-behaved strategy will have losing streaks. Study the sequence of losses, not just the wins, so you know what a normal rough patch looks like.
- Diversify and avoid over-leverage. Concentrating too much risk in one instrument or using excessive leverage can turn a routine drawdown into a serious loss.
- Review and journal. Keep notes on parameter changes and outcomes so your learning compounds over time.
Risk Warning
Trading foreign exchange, CFDs, and other leveraged financial instruments involves substantial risk of loss and is not suitable for all investors. The strategies and tools discussed on this page are provided for educational purposes only and do not constitute financial advice, investment recommendations, or solicitation to trade. Always consult a qualified financial adviser before making trading decisions. Past backtest performance is not indicative of future results.
Downloads
- Expert Advisor: AsymmetricCaptureMomentum.ex5 (47 downloads)
- Source Code: AsymmetricCaptureMomentum.mq5 (49 downloads)
- Documentation: AsymmetricCaptureMomentum.pdf (47 downloads)