Disclaimer: This article is for educational and informational purposes only. It does not constitute financial or investment advice. Trading forex and CFDs carries significant risk of loss. Past performance of any strategy — including backtests — does not guarantee future results. Never trade with money you cannot afford to lose.
What Is This Strategy?
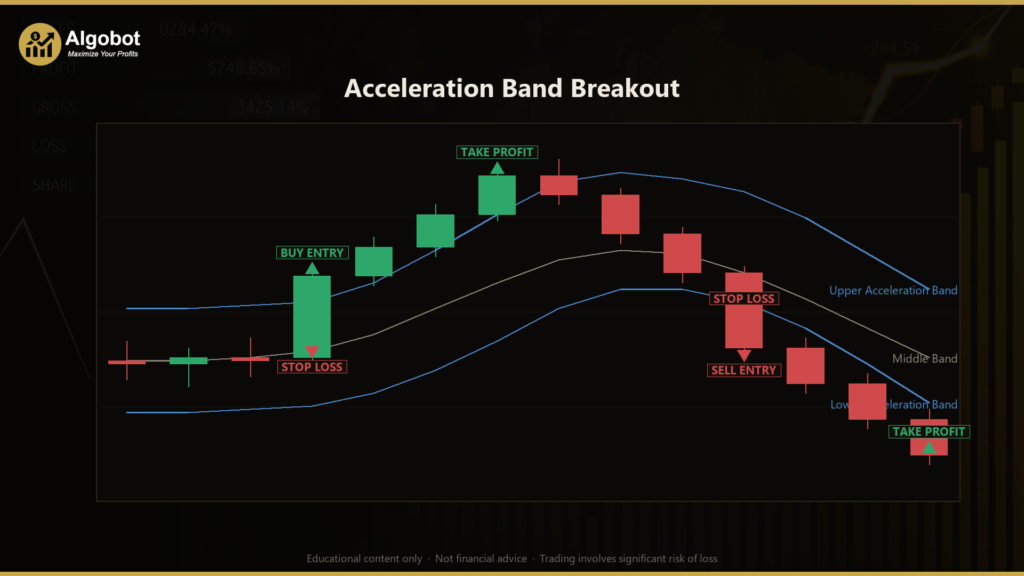
The Acceleration Band Breakout is a trend-following, volatility-envelope breakout strategy built on Price Headley's Acceleration Bands indicator. Instead of using a fixed-width channel around price, Acceleration Bands widen and narrow according to each bar's own normalised range — the distance between its high and low relative to its midpoint. In plain terms, the bands "breathe" with volatility: they expand when the market is moving quickly and contract when it goes quiet. A breakout signal is only produced when price genuinely accelerates beyond what that recent expansion can account for.
This strategy is designed for trending, momentum-driven market conditions — the kind of environment where a currency pair or index breaks out of a range and continues in one direction. Because the envelope adapts to volatility, the strategy tries to distinguish a real acceleration from ordinary noise. A built-in trend filter (the slope of the middle band) keeps it from chasing counter-trend pokes through the envelope, which is a common cause of whipsaw losses in simpler breakout systems.
As a learning tool, the Acceleration Band Breakout is well suited to traders who want to study how adaptive volatility bands behave compared with fixed indicators like Bollinger Bands, and how a directional filter can reduce false signals. It is not a shortcut to results, but a clear, parameter-light example of how breakout logic, a trend filter, and Average True Range (ATR) based risk control can be combined into a single, readable system. Treat it as a framework for understanding volatility breakouts, not as a finished trading recommendation.
How It Works
The strategy evaluates the market once per completed candle. It never acts on a bar that is still forming — it waits for the previous candle to close and then makes its decision. Here is what it checks, step by step:
- Building the bands. For every bar it calculates a normalised range
r = (High − Low) / ((High + Low) / 2). From that it forms an upper raw levelHigh × (1 + Factor × r)and a lower raw levelLow × (1 − Factor × r). Smoothing each of these with a simple moving average (SMA) overBandPeriodbars produces the Upper and Lower Acceleration Bands. The Middle band is simply the SMA of closing prices over the same period.
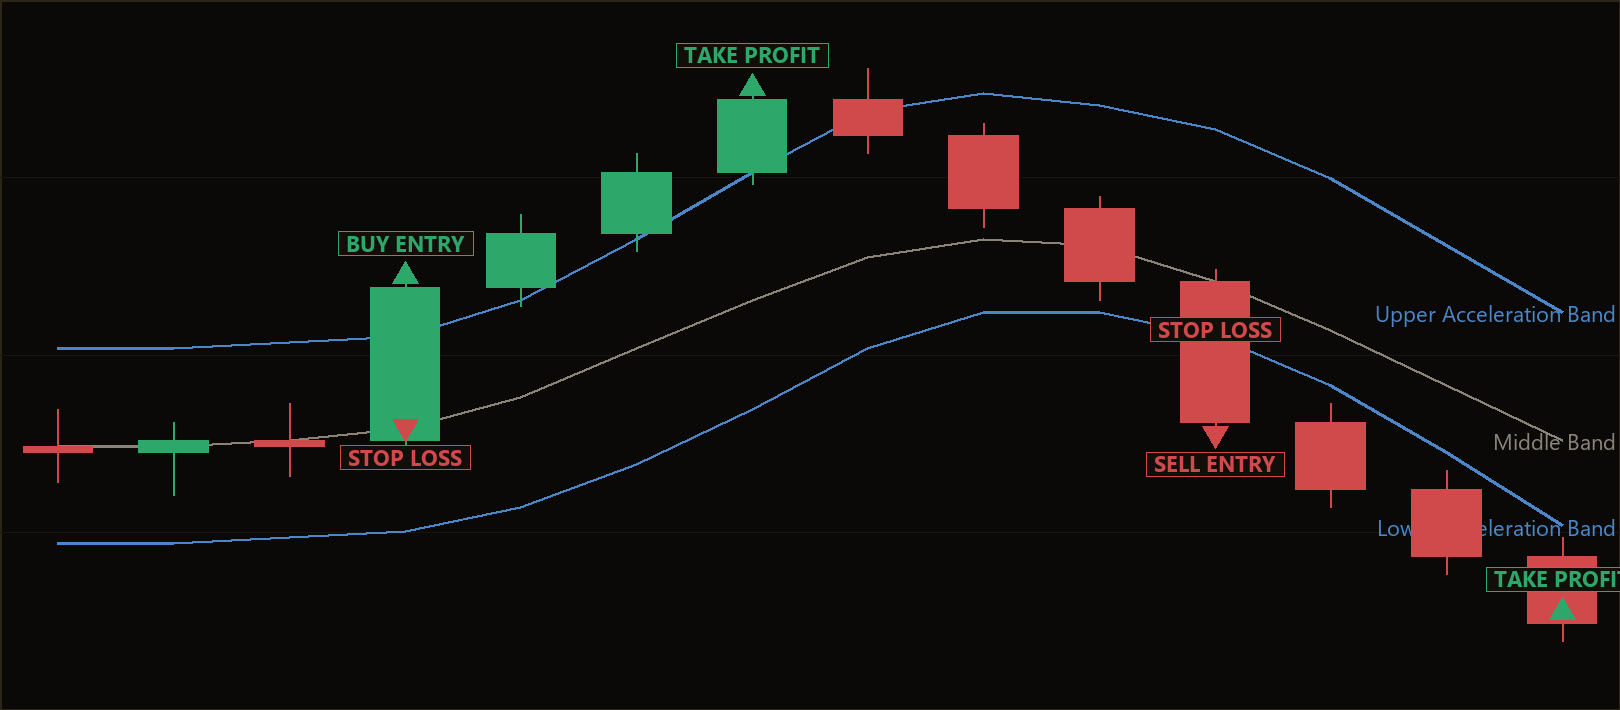
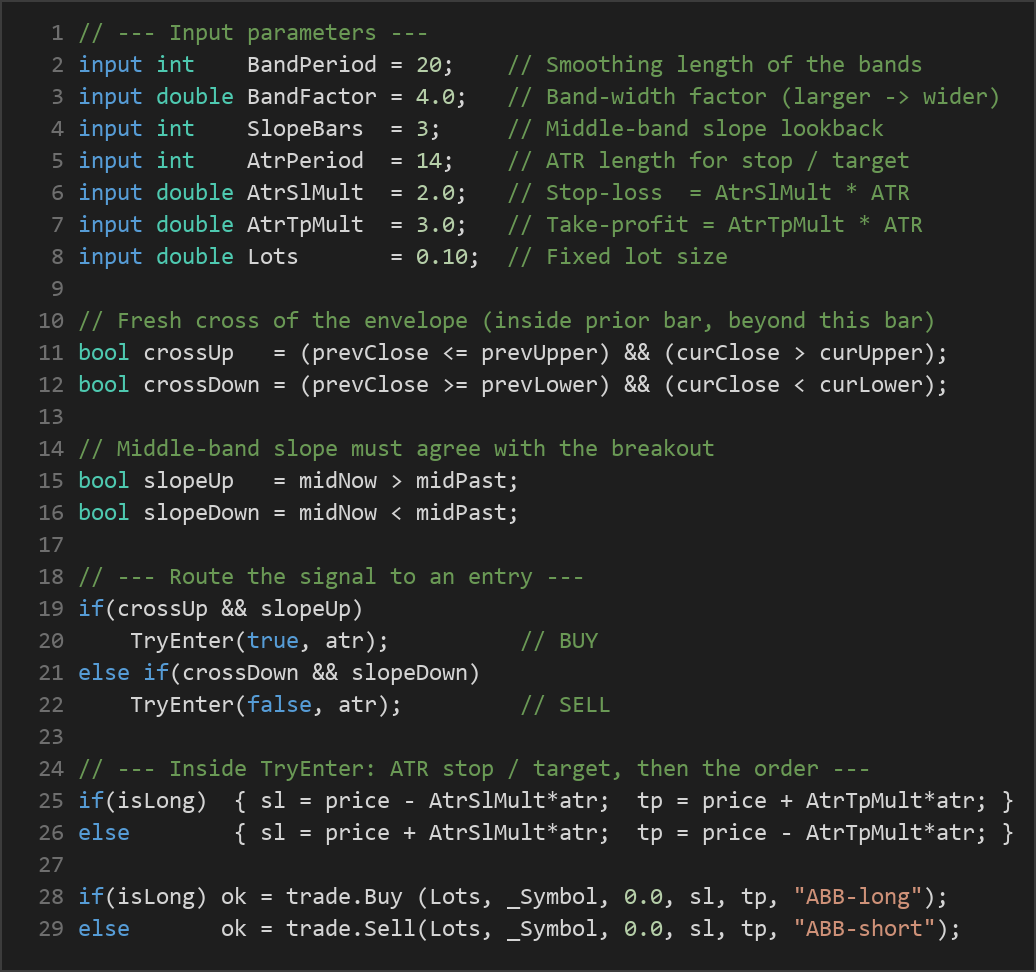
- Long entry signal. The strategy signals a long (buy) only on a fresh upside cross: the just-completed candle must close above the Upper band while the prior candle closed inside (at or below) it. This rules out bars that were already outside the envelope and only counts a genuine new breakout.
- Short entry signal. Symmetrically, it signals a short (sell) when the just-completed candle closes below the Lower band while the prior candle closed inside (at or above) it. The long and short rules are distinct and mirror-imaged.
- Trend filter. Before any trade is taken, the slope of the Middle band over the last
SlopeBarsbars must agree with the breakout direction. For a long, the Middle band must be rising; for a short, it must be falling. This anti-whipsaw filter means the strategy only takes expansions that move with the prevailing drift, skipping counter-trend breakouts.
- Stop-loss logic. Risk is defined using the Average True Range (ATR), a measure of recent volatility. When a position opens, the stop-loss is placed
AtrSlMult × ATRaway from the entry price — below entry for longs, above entry for shorts. Because ATR scales with volatility, the stop distance automatically widens in fast markets and tightens in calm ones.
- Take-profit logic. The take-profit target is placed
AtrTpMult × ATRfrom entry in the trade's favour. With the default settings, the target distance (3× ATR) is larger than the stop distance (2× ATR), giving a reward-to-risk ratio of roughly 1.5 to 1 on each trade.
- Position management. The strategy holds only one position per magic number at a time. It will not open a new trade while an existing one is live, and it uses fixed-lot position sizing. If the calculated ATR or stop distance is zero or negative, the trade is skipped entirely as a safety guard.
Strategy Parameters
| Parameter | Default | Min | Max | Description |
|---|---|---|---|---|
| BandPeriod | 20 | 10 | 50 | Smoothing length (SMA period) of the Acceleration Bands and the Middle band. Larger values give slower, steadier bands. |
| BandFactor | 4.0 | 1.0 | 8.0 | Band-width factor. A larger value widens the envelope, producing fewer but stronger breakout signals. |
| SlopeBars | 3 | 1 | 10 | Lookback used to measure the Middle-band slope for the trend filter. |
| AtrPeriod | 14 | 7 | 30 | Number of bars used to calculate ATR for the stop and target distances. |
| AtrSlMult | 2.0 | 1.0 | 4.0 | Stop-loss distance as a multiple of ATR (entry −/+ AtrSlMult × ATR). |
| AtrTpMult | 3.0 | 1.0 | 6.0 | Take-profit distance as a multiple of ATR (entry +/− AtrTpMult × ATR). |
| Lots | 0.10 | 0.01 | 1.0 | Fixed lot size used for every trade. |
The parameter set is deliberately small and broadly ranged. Fewer parameters with wide, sensible ranges reduce the temptation to over-optimise (or "curve-fit") the strategy to one historical period.
Recommended Chart Settings
The Acceleration Band Breakout is a single-timeframe strategy: every calculation uses the chart's own period, so it runs on whatever timeframe you attach it to. A common starting point for studying volatility breakouts is a major forex pair such as EUR/USD on the H1 (1-hour) or H4 (4-hour) timeframe, where trends develop clearly and spreads are typically low. Higher timeframes tend to produce fewer, cleaner signals; lower timeframes produce more signals but also more noise.
There is no single "correct" symbol or timeframe. The band and ATR parameters interact with the volatility character of each instrument, so behaviour will vary considerably across pairs, indices, and timeframes. Always study how the strategy behaves on your chosen market in a testing environment before drawing any conclusions, and remember that results will differ across changing market conditions.
How to Install on MetaTrader 5
- Download the
.ex5file from the link below - Copy it to your MT5
MQL5\Expertsfolder - Restart MetaTrader 5 or refresh the Navigator panel
- Drag the EA onto a chart matching the recommended symbol and timeframe
- Configure the input parameters and enable Algo Trading
What to Consider Before Using This EA
Every strategy has trade-offs, and an honest assessment matters more than a sales pitch.
Strengths. The adaptive envelope is the strategy's main appeal: because the bands respond to each bar's own range, the same settings can behave reasonably across periods of high and low volatility without manual retuning. The Middle-band slope filter is a genuine improvement over naive breakout systems, since it removes many counter-trend false signals. Using ATR for both the stop and target means risk scales automatically with market conditions rather than being fixed in pips.
Known limitations. Like all breakout systems, this approach is vulnerable to range-bound, choppy markets. When price oscillates sideways, it can repeatedly poke just past a band and reverse, producing a string of small losses — a pattern often called whipsaw. The slope filter reduces this but cannot eliminate it. Because entries are confirmed only on a candle close beyond the band, the strategy enters after part of the move has already happened, which can mean giving up some early momentum. Fixed-lot sizing also means position size does not adapt to account equity or per-trade risk.
Where it may underperform. Expect weaker behaviour during low-volatility consolidation, around major news spikes that reverse quickly, and on illiquid instruments with wide spreads. It is designed for sustained directional moves, so markets that lack them will not suit it. None of this makes the strategy "good" or "bad" — it simply defines the conditions it was built for.
Risk Management Tips
Sound risk management matters more than any single entry rule. A few general principles to study:
- Risk a small, fixed fraction per trade. Many educational sources suggest risking no more than 1–2% of account equity on any single position. With fixed-lot sizing, you may need to adjust the
Lotsinput so the stop distance corresponds to that fraction on your account. - Understand drawdown. Even a well-designed strategy will endure losing streaks. Study the largest historical peak-to-trough decline before committing capital, and ask whether you could stay disciplined through it.
- Always test on a demo account first. Run the strategy on a demo or paper-trading account for an extended period to understand its behaviour before considering any live use.
- Mind spreads, commissions, and slippage. Real-world costs erode breakout systems, especially on lower timeframes with many trades. Include them in any evaluation.
- Never trade money you cannot afford to lose, and treat leverage with respect — it magnifies losses as readily as gains.
Risk Warning
Trading foreign exchange, CFDs, and other leveraged financial instruments involves substantial risk of loss and is not suitable for all investors. The strategies and tools discussed on this page are provided for educational purposes only and do not constitute financial advice, investment recommendations, or solicitation to trade. Always consult a qualified financial adviser before making trading decisions. Past backtest performance is not indicative of future results.
Downloads
- Expert Advisor: AccelerationBandBreakout.ex5 (59 downloads)
- Source Code: AccelerationBandBreakout.mq5 (62 downloads)
- Documentation: AccelerationBandBreakout.pdf (61 downloads)