
Disclaimer: This article is for educational and informational purposes only. It does not constitute financial or investment advice. Trading forex and CFDs carries significant risk of loss. Past performance of any strategy — including backtests — does not guarantee future results. Never trade with money you cannot afford to lose.
What Is This Strategy?
The Pivot Pullback Thrust strategy is a pure price-action, trend-continuation system for MetaTrader 5 that uses no traditional indicators at all — no moving averages, no oscillators, no momentum gauges. Instead, it reads the raw structure of the market directly from candlestick highs and lows. The core building block is the fractal swing pivot: a confirmed swing high or swing low that has a set number of strictly weaker bars on each side of it. By tracking how these pivots line up, the strategy identifies whether the market is making higher highs and higher lows (an uptrend) or lower highs and lower lows (a downtrend).
This is a classic "break-of-structure" reading of the chart, the same logic many discretionary price-action traders use by eye. Pivot Pullback Thrust is designed for trending market conditions, where price moves in a directional sequence punctuated by shallow counter-moves. It looks to join an established trend after a brief pause — buying a dip inside an uptrend, or selling a rally inside a downtrend — rather than predicting reversals or chasing breakouts blindly.
As a learning tool, this strategy is well suited to traders who want to understand how market structure, pullbacks, and momentum candles fit together without the abstraction of indicators. Because every decision traces back to a visible candle on the chart, it is an excellent way to study how trend-following entries are constructed and why disciplined stop placement matters. Treat it as a framework for studying price action — not as a profit opportunity.
How It Works
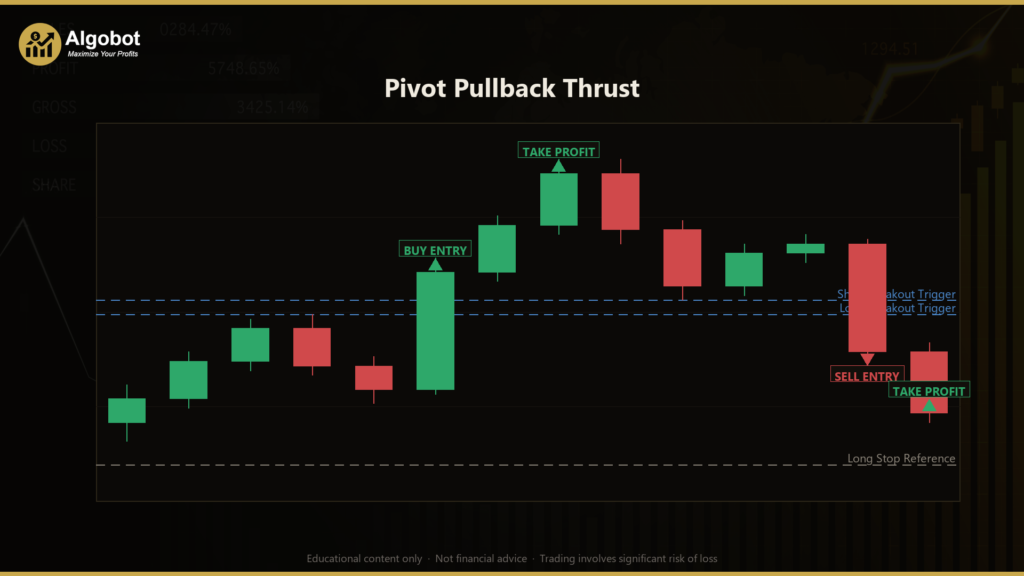
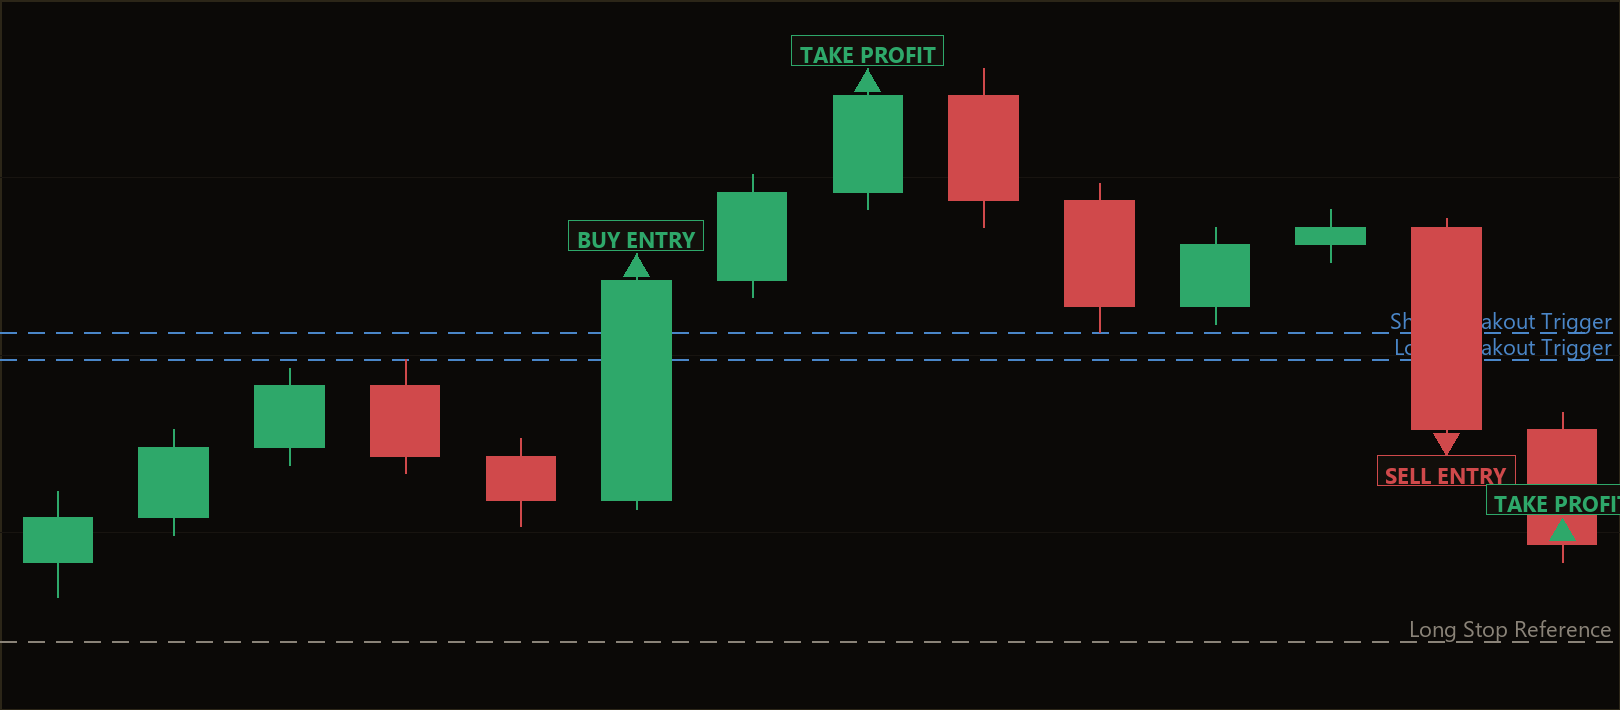
The strategy combines four ideas — structure, pullback, thrust, and risk — into a single entry. Here is how the strategy signals a trade, step by step:
- Structure (trend definition): The strategy continuously confirms fractal swing pivots. A pivot high is a bar whose high is greater than the high of every bar within the swing window on both sides; a pivot low is the mirror image. When the most recent swing high is above the previous swing high and the most recent swing low is above the previous swing low, the strategy reads an uptrend. The opposite pattern (lower high and lower low) defines a downtrend. If neither pattern is fully formed, no trade is considered.
- Pullback (the dip or rally): Within a short "trigger window" of recent bars, the strategy requires at least one opposing candle — a bearish (down) candle inside an uptrend, or a bullish (up) candle inside a downtrend. This ensures the strategy is entering after a shallow counter-move rather than chasing a market that has already run.
- Thrust (the momentum entry): Entry fires only on a momentum candle. This is defined two ways at once: the candle's body must be large relative to its own range (controlled by the Body Ratio parameter), and its total range must be equal to or larger than the prior bar's range — an expanding, decisive bar. The candle must also close beyond the high (for longs) or low (for shorts) of the trigger window, signalling a breakout in the direction of structure.
- Long entry: The strategy signals a buy when there is an uptrend, a recent down candle in the window, the current candle is bullish, and its close breaks above the window high.
- Short entry: The strategy signals a sell when there is a downtrend, a recent up candle in the window, the current candle is bearish, and its close breaks below the window low.
- Stop-loss logic: For a long, the stop is placed just below the lower of the breakout bar's low and the last swing low, minus a buffer. For a short, it is placed just above the higher of the breakout bar's high and the last swing high, plus a buffer. The buffer is a fraction of the thrust candle's range, so the stop sits at a real support/resistance reference rather than an arbitrary distance.
- Take-profit logic: The take-profit is set as a fixed reward-to-risk multiple of the stop distance. With the default Reward-Risk of 2.0, the target sits twice as far from entry as the stop.
- One position at a time: Only one position per magic number is allowed. While a trade is open, it runs to its own stop or target before any new signal is evaluated.
Strategy Parameters
| Parameter | Default | Min | Max | Description |
|---|---|---|---|---|
| SwingStrength | 3 | 2 | 6 | Number of bars required on each side of a candle for it to count as a confirmed fractal swing pivot. Higher values demand more significant, slower-forming pivots. |
| TriggerLookback | 3 | 2 | 6 | Length of the pullback/breakout window — how many recent bars are scanned for a counter-move and used to define the breakout high/low. |
| BodyRatio | 0.55 | 0.30 | 0.80 | Minimum body-to-range ratio for the thrust candle. Higher values require a more decisive, full-bodied momentum candle to trigger entry. |
| RewardRisk | 2.0 | 1.0 | 4.0 | Take-profit distance as a multiple of the stop distance. A value of 2.0 means the target is twice the risk. |
| StopBufferFactor | 0.5 | 0.1 | 1.5 | Extra stop-loss buffer expressed as a fraction of the thrust candle's range, placed beyond the breakout bar / last swing. |
| Lots | 0.10 | 0.01 | 1.0 | Fixed order volume (position size) per trade. |
Recommended Chart Settings
Because the strategy reads market structure from raw OHLC bars on the primary timeframe only, it is timeframe-agnostic in design but works best where swings and pullbacks are clean and well-defined. A common starting point for studying this style is a major forex pair such as EUR/USD on the H1 (1-hour) timeframe, which tends to produce orderly trends with readable pullbacks. Higher timeframes generally produce fewer but more structurally significant signals, while lower timeframes generate more noise.
Keep in mind that results will vary considerably across different symbols, sessions, and market conditions. A setting that produces tidy structure on one instrument may behave very differently on another, so always test any symbol and timeframe combination on historical data and a demo account before drawing conclusions.
Historical Backtest Results
Note: The figures below are from a historical backtest simulation. Backtests have inherent limitations — they do not account for slippage, requotes, spread widening, or psychological factors. These results should not be interpreted as a prediction of future performance.
No backtest data is available for the Pivot Pullback Thrust strategy at the time of writing. When a historical simulation is run, the key metrics to examine include Net Profit, Profit Factor, Sharpe Ratio, Win Rate, Maximum Drawdown %, and Total Trades. Until such a test is published, treat this strategy purely as an educational framework, and run your own backtest in the MetaTrader 5 Strategy Tester to understand how it behaves across different periods and market regimes before considering it on a demo account.
How to Install on MetaTrader 5
- Download the
PivotPullbackThrust.ex5file from the link below. - Copy it to your MT5
MQL5\Expertsfolder. - Restart MetaTrader 5 or refresh the Navigator panel.
- Drag the EA onto a chart matching the recommended symbol and timeframe.
- Configure the input parameters and enable Algo Trading.
What to Consider Before Using This EA
Like any strategy, Pivot Pullback Thrust has strengths and limitations worth understanding before you study it in a live environment.
Strengths. The logic is transparent and entirely price-based — every entry can be traced to visible candles, which makes it easy to audit and learn from. By requiring structure, a pullback, and a momentum breakout simultaneously, it filters out many low-quality setups and only acts in the direction of an established trend. Stops are anchored to genuine swing levels rather than fixed pip distances, which is a sound structural approach to risk.
Limitations. The strategy is built for trending conditions and is likely to underperform in range-bound or choppy markets, where false breakouts and whipsaws are common. Because it waits for confirmed swing pivots, signals can lag the start of a move, and a strict Body Ratio may cause it to miss valid entries that lack a single dominant momentum candle. It also takes only one position at a time and has no trailing stop or breakeven logic — each trade simply runs to its fixed stop or target. As with all breakout-based approaches, spread widening and slippage around the entry bar can meaningfully affect real-world results compared with a backtest.
This is an analytical framework, not a guaranteed outcome. The goal is to understand how and why it enters, so you can judge for yourself where it fits.
Risk Management Tips
Sound risk management matters more than any single entry signal. Consider these general principles as you study this or any strategy:
- Risk a small, fixed percentage per trade. Many educators suggest never risking more than 1–2% of account equity on a single position, so that a string of losses does not threaten your capital.
- Size positions to your stop, not the other way around. Because this strategy places stops at structural levels, the distance varies. Adjust your lot size so the monetary risk stays consistent rather than using a fixed lot blindly.
- Use a demo account first. Test the EA on a demo for an extended period across different market conditions before considering any real capital.
- Understand drawdown. Even a well-designed trend strategy will experience losing streaks. Know the maximum drawdown you are prepared to tolerate, and recognise that historical drawdown figures may be exceeded in the future.
- Account for costs. Spreads, commissions, and slippage all reduce real-world results relative to an idealised backtest.
Risk Warning
Trading foreign exchange, CFDs, and other leveraged financial instruments involves substantial risk of loss and is not suitable for all investors. The strategies and tools discussed on this page are provided for educational purposes only and do not constitute financial advice, investment recommendations, or solicitation to trade. Always consult a qualified financial adviser before making trading decisions. Past backtest performance is not indicative of future results.
Downloads
- Expert Advisor: PivotPullbackThrust.ex5 (1 downloads)
- Source Code: PivotPullbackThrust.mq5 (1 downloads)
- Documentation: PivotPullbackThrust.pdf (1 downloads)