
Disclaimer: This article is for educational and informational purposes only. It does not constitute financial or investment advice. Trading forex and CFDs carries significant risk of loss. Past performance of any strategy — including backtests — does not guarantee future results. Never trade with money you cannot afford to lose.
What Is This Strategy?
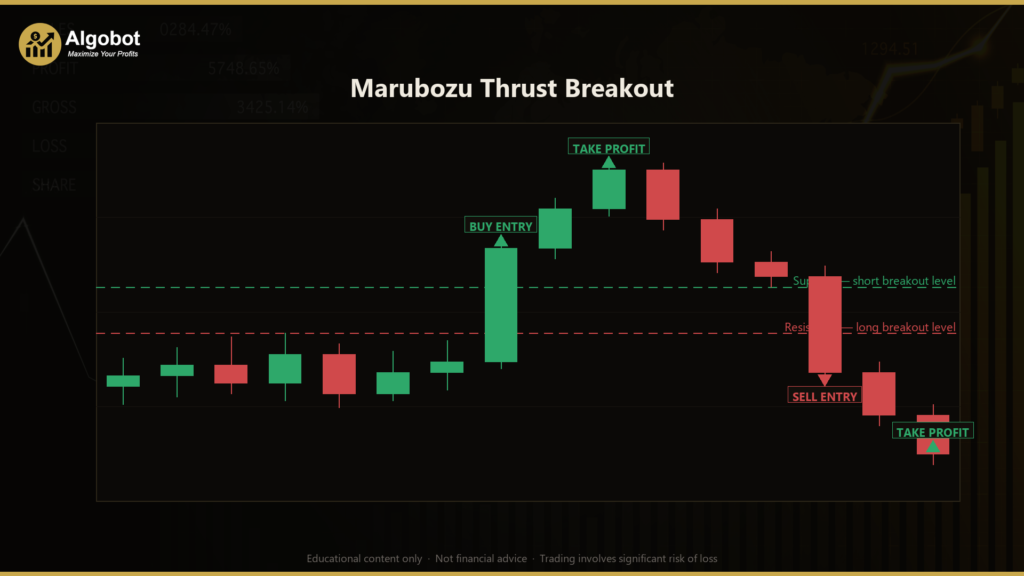
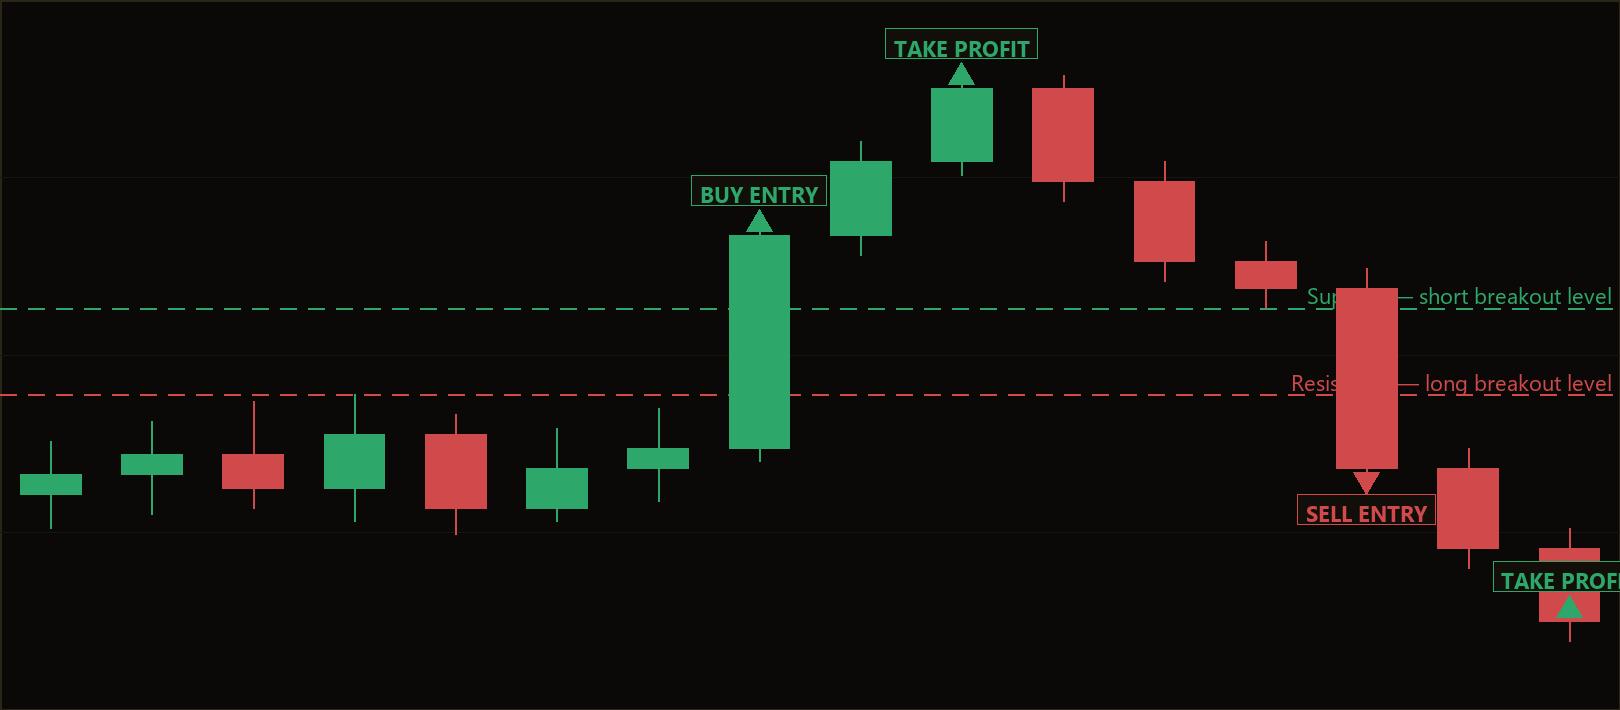
The Marubozu Thrust Breakout is a pure price-action, momentum-breakout strategy that uses no traditional indicators at all — no moving averages, no RSI, no ATR. Instead, it reads raw candlestick data (open, high, low, close) to detect a single, decisive type of bar: a marubozu thrust. A marubozu is a candlestick with a large body and very small wicks, meaning price opened near one extreme and closed near the other with little hesitation. When such a candle also expands sharply in size relative to recent bars, it can signal a genuine momentum impulse rather than ordinary market noise.
This strategy is designed for trending or breakout-prone market conditions, where price periodically escapes a consolidation range with conviction. The core idea is simple: a powerful thrust candle only "counts" as a trade signal when it also breaks a recent swing high or swing low — a level the strategy treats as short-term support or resistance. Combining body strength, range expansion, and a structural breakout is what separates a meaningful move from a random spike.
As a learning tool, the Marubozu Thrust Breakout is well suited to traders who want to understand how candlestick anatomy, volatility expansion, and market structure can be combined into a single rules-based system. Because every decision is derived from visible price behavior, it is transparent and easy to study. This article is a strategy analysis intended to help you learn how the logic works — not a profit opportunity or a recommendation to trade.
How It Works
The strategy evaluates only fully-closed candles, acting once per newly-formed bar. On each new bar it inspects the candle that just closed (the "thrust candidate") and checks a sequence of conditions in order. If any condition fails, no trade is taken.
- Body strength filter: The strategy measures the candle body (the distance between open and close) as a fraction of its total range (high minus low). If this body-to-range ratio is below
ThrustBodyRatio, the candle is not "marubozu enough" and is rejected. - Range expansion filter: It computes the average range of the recent bars behind the thrust over the
AvgRangePeriodwindow. The thrust candle's range must exceed this average by a factor ofRangeExpansion. This confirms the move represents genuine volatility expansion, not a quiet bar. - Market structure levels: Using the
StructureLookbackwindow behind the thrust, the strategy finds the highest high (resistance) and lowest low (support). These define the breakout levels. - Long entry — the strategy signals a buy when: the thrust candle is bullish (closes above its open) and its close finishes above the recent resistance level. Entry is placed at the current Ask price.
- Short entry — the strategy signals a sell when: the thrust candle is bearish (closes below its open) and its close finishes below the recent support level. Entry is placed at the current Bid price.
- Stop-loss logic: Risk is defined by the candle itself. For a long, the stop sits just below the thrust's low; for a short, just above its high. A buffer —
StopBufferPctof the candle range — is added beyond that extreme to allow a little breathing room. - Take-profit logic: The target is a fixed multiple of the measured risk. The distance from entry to stop is multiplied by
RewardRiskand projected in the trade's direction. ARewardRiskof 2.00, for example, sets the take-profit twice as far from entry as the stop. - One position at a time: The strategy holds only a single open position per magic number, so it will not stack multiple trades on the same signal.
Strategy Parameters
| Parameter | Default | Min | Max | Description |
|---|---|---|---|---|
| ThrustBodyRatio | 0.65 | 0.50 | 0.90 | Minimum body-to-range ratio for a candle to qualify as a marubozu "thrust". Higher values demand a cleaner, more decisive candle. |
| RangeExpansion | 1.60 | 1.10 | 3.00 | How many times larger the thrust's range must be versus the recent average range. Higher values require stronger momentum expansion. |
| StructureLookback | 12 | 5 | 40 | Number of bars behind the thrust used to find the swing high/low (the breakout support/resistance level). |
| AvgRangePeriod | 14 | 5 | 30 | Number of bars used to compute the average candle range — the momentum baseline. |
| StopBufferPct | 0.20 | 0.00 | 1.00 | Extra stop-loss distance beyond the thrust candle's extreme, expressed as a fraction of the candle's range. |
| RewardRisk | 2.00 | 1.00 | 4.00 | Take-profit distance as a multiple of the entry-to-stop risk. |
| Lots | 0.10 | 0.01 | 1.00 | Fixed position size in lots. |
Recommended Chart Settings
This strategy is built to operate on a single primary symbol and timeframe — the chart it is attached to in MetaTrader 5. Because breakout behavior and candle volatility vary by instrument, the Marubozu Thrust Breakout is typically studied on liquid major forex pairs and on intraday-to-higher timeframes (for example H1 or above), where thrust candles and clean swing levels tend to be more meaningful and less prone to spread-driven noise.
There is no universally "correct" chart for this approach. The default parameters are a starting point for analysis, not an optimized configuration. Results will vary considerably across different symbols, timeframes, and market conditions, so you should treat any single setup as one data point in a broader study rather than a finished system.
Historical Backtest Results
Note: The figures below are from a historical backtest simulation. Backtests have inherent limitations — they do not account for slippage, requotes, spread widening, or psychological factors. These results should not be interpreted as a prediction of future performance.
No backtest data is available for this strategy yet. When a historical simulation has been run, this section will report the standard performance metrics — Net Profit, Profit Factor, Sharpe Ratio, Win Rate, Maximum Drawdown, and Total Trades — using only the real measured figures. Until then, no performance numbers are presented here, and none should be assumed. You are encouraged to run your own backtests across multiple symbols and timeframes to understand how the strategy behaves before drawing any conclusions.
How to Install on MetaTrader 5
- Download the
MarubozuThrustBreakout.ex5file from the link below. - Copy it to your MT5
MQL5\Expertsfolder. - Restart MetaTrader 5 or refresh the Navigator panel.
- Drag the EA onto a chart matching the recommended symbol and timeframe.
- Configure the input parameters and enable Algo Trading.
What to Consider Before Using This EA
The strength of the Marubozu Thrust Breakout lies in its transparency and its multi-layered filtering. By requiring a strong body, a clear expansion in range, and a structural breakout simultaneously, it aims to ignore the many small or indecisive moves that trigger weaker breakout systems. Defining risk directly from the signal candle is also a clean, logical approach: the stop is anchored to the very bar that produced the setup.
That said, every approach has known limitations. Breakout systems are vulnerable to false breakouts — bars that pierce a level and then reverse — and a single large thrust candle can sometimes mark the end of a move rather than the start of one. In quiet, range-bound markets the expansion and breakout conditions may rarely align, producing few signals; in choppy, whipsawing conditions they may align too often and produce losing trades in quick succession. The fixed reward-to-risk target also means winners are capped, so the strategy depends on its win rate and the size of its moves to remain balanced over time. None of these traits are flaws to be hidden — they are simply the characteristics of a momentum-breakout method that you should understand before studying it on live or demo data.
Risk Management Tips
Sound risk management matters far more than any single entry rule. As a general educational guideline, many traders limit the risk on any one trade to roughly 1–2% of account equity, sizing positions so that the distance to the stop-loss represents that small fraction rather than trading a fixed lot blindly. Always test an EA on a demo account first, for a meaningful period and across varied market conditions, before considering real capital.
Understand drawdown — the peak-to-trough decline in equity — and ask yourself whether you could tolerate the worst stretch a strategy might produce. Keep a margin of safety, avoid over-leveraging, and remember that consistent process discipline is what allows a rules-based system to be evaluated fairly. No strategy removes risk; risk management only helps you survive long enough to learn from the results.
Risk Warning
Trading foreign exchange, CFDs, and other leveraged financial instruments involves substantial risk of loss and is not suitable for all investors. The strategies and tools discussed on this page are provided for educational purposes only and do not constitute financial advice, investment recommendations, or solicitation to trade. Always consult a qualified financial adviser before making trading decisions. Past backtest performance is not indicative of future results.
Downloads
- Expert Advisor: MarubozuThrustBreakout.ex5 (1 downloads)
- Source Code: MarubozuThrustBreakout.mq5 (1 downloads)
- Documentation: MarubozuThrustBreakout.pdf (0 downloads)