
Disclaimer: This article is for educational and informational purposes only. It does not constitute financial or investment advice. Trading forex and CFDs carries significant risk of loss. Past performance of any strategy — including backtests — does not guarantee future results. Never trade with money you cannot afford to lose.
What Is This Strategy?
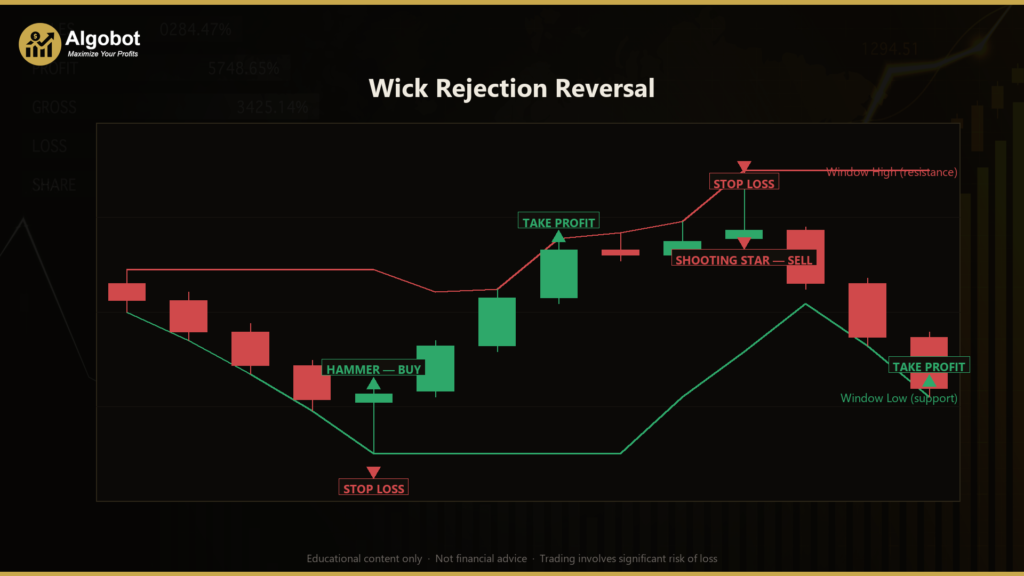
The Wick Rejection Reversal is a pure price-action strategy built around the pin bar (also called a rejection candle), a single candlestick with a long wick and a small body that marks where price probed a level and was sharply pushed back before the close. It is a counter-trend, mean-reversion approach: rather than following momentum, it looks for the moment a directional push fails at an extreme of the recent range. There are no moving averages, no oscillators, and no lagging indicators anywhere in the logic — every condition is measured directly from the geometry of the raw candle and where that candle sits inside a recent swing window.
A pin bar earns its name because the long wick "pins" a rejected price level. When a candle drives down, tags a fresh low, and then closes back near its high, it leaves a long lower wick — a hammer — that historically signals sellers were rejected at support. The mirror image, a long upper wick with a close near the low (a shooting star), signals buyers were rejected at resistance. The Wick Rejection Reversal only acts when one of these patterns forms at the edge of the recent range, where the rejection carries the most structural meaning.
This strategy is best suited to traders who want to learn how price-action pattern recognition can be expressed in code. Because the rules are entirely geometric, it is a clear teaching tool for understanding candle anatomy, range context, and structural stop placement. It is designed for liquid instruments such as GBP/USD or XAU/USD on the H1 (1-hour) timeframe, where pin bars at swing extremes are common enough to study. Treat it as a framework for analysis and experimentation — not as a shortcut to results.
How It Works
The strategy evaluates only freshly closed candles. On each new bar it inspects the most-recently-closed candle (the "pin candidate") and measures it against the range that preceded it. It holds only one position at a time per its magic number, so it never stacks trades.
Setup measurements (taken from the candle's raw geometry):
- Range = candle high − candle low.
- Body = absolute distance between open and close (a small body suggests indecision).
- Lower wick = distance from the body's bottom down to the candle low (rejection of lower prices).
- Upper wick = distance from the candle high down to the body's top (rejection of higher prices).
- Window extremes = the lowest low and highest high over the
Lookbackcandles that come before the pin, used to define the recent range.
The strategy signals a long (bullish hammer) when all of these are true:
- The body is small — no larger than
BodyRatioof the candle's range (an indecisive close). - The lower wick is dominant — at least
WickRatioof the range (deep rejection of lower prices). - The upper wick is no larger than the body (little overhead supply pushing back).
- The candle closes in the upper third of its range (it closed strong).
- The candle's low tags or undercuts the window's lowest low — the rejection happened right at support.
The strategy signals a short (bearish shooting star) as the exact mirror: a small body, a dominant upper wick of at least WickRatio of the range, a lower wick no larger than the body, a close in the lower third of the range, and a high that tags or exceeds the window's highest high — rejection right at resistance.
Stop-loss logic: The stop sits just past the rejection wick, where the trade idea is invalidated. For a long, the stop is placed below the pin's low minus a buffer equal to BufferFrac of the candle's range. For a short, it is placed above the pin's high plus the same buffer. This is a structural stop — it is defined by the chart, not by a fixed pip count.
Take-profit logic: The target is a fixed multiple of that structural risk. The distance from entry to stop is measured as the "risk," and the take-profit is set at RiskReward times that distance in the direction of the trade. With the default risk/reward of 2.0, the target sits twice as far from entry as the stop. Both the stop and target are attached when the order is sent, so each trade has predefined exit levels.
Strategy Parameters
| Parameter | Default | Min | Max | Description |
|---|---|---|---|---|
| Lots | 0.10 | 0.01 | 1.00 | Fixed trade size in lots for each position opened. |
| Lookback | 20 | 5 | 60 | Number of candles before the pin used to define the recent swing high and low. |
| WickRatio | 0.60 | 0.40 | 0.85 | Minimum size of the dominant wick as a fraction of the candle's range — higher values demand a more pronounced rejection. |
| BodyRatio | 0.30 | 0.10 | 0.50 | Maximum body size as a fraction of the candle's range — lower values demand a smaller, more indecisive body. |
| RiskReward | 2.0 | 1.0 | 5.0 | Take-profit distance as a multiple of the structural stop distance. |
| BufferFrac | 0.15 | 0.00 | 1.00 | Extra stop padding beyond the rejection wick, as a fraction of the candle's range. |
Recommended Chart Settings
The Wick Rejection Reversal was designed for GBP/USD or XAU/USD (gold) on the H1 (1-hour) timeframe, where rejection candles at range extremes are frequent enough to study and the spread is generally manageable on liquid sessions. The geometric rules are not symbol-specific, so the logic can be applied to any liquid instrument and timeframe — but the character of pin bars, average range, and noise differ between markets. Results will vary considerably across different symbols, sessions, and market conditions, so any new combination should be tested and observed independently before drawing conclusions.
Historical Backtest Results
Note: The figures below are from a historical backtest simulation. Backtests have inherent limitations — they do not account for slippage, requotes, spread widening, or psychological factors. These results should not be interpreted as a prediction of future performance.
No backtest data is available for this strategy at the time of writing. Once a historical simulation has been run on the recommended symbol and timeframe, key metrics — such as net profit, profit factor, win rate, maximum drawdown, and total trades — would be reported here. Until then, you are encouraged to run your own backtest in the MetaTrader 5 Strategy Tester and to interpret any output as a historical simulation only, with the limitations noted above.
How to Install on MetaTrader 5
- Download the
WickRejectionReversal.ex5file from the link below. - Copy it to your MT5
MQL5\Expertsfolder. - Restart MetaTrader 5 or refresh the Navigator panel.
- Drag the EA onto a chart matching the recommended symbol and timeframe (e.g. GBP/USD or XAU/USD, H1).
- Configure the input parameters and enable Algo Trading.
What to Consider Before Using This EA
Strengths of this approach. The logic is transparent and entirely rule-based — there are no hidden indicators, so every entry can be explained by the geometry of a single candle and its position in the range. Stops are placed at a structural level (just past the rejection wick) rather than at an arbitrary distance, which ties risk directly to where the pattern would be invalidated. The fixed risk/reward target enforces a consistent, predefined exit on every trade, which makes the strategy a clean tool for studying disciplined trade management.
Known limitations of the pin-bar pattern. Pin bars are a context-dependent signal. The same candle shape that historically marks a genuine reversal at a key level can also appear in the middle of a strong trend, where counter-trend entries are repeatedly run over. Because this is a mean-reversion strategy, it can struggle in sustained, one-directional trends — the very conditions where "rejected" lows or highs keep getting broken. A single-candle pattern also carries no guarantee of follow-through; the rejection may simply pause the move rather than reverse it.
Conditions where it may underperform. Strong trending markets, high-impact news spikes, and low-liquidity sessions can all produce false rejections or wide spreads that the geometric rules do not account for. Very tight structural stops (small BufferFrac values) may be vulnerable to normal market noise, while very wide stops reduce the reward relative to risk. As with any pattern-based system, the strategy may experience clusters of losing trades during unfavourable regimes. None of these limitations make the approach unusable — but they are essential to understand before committing to any settings.
Risk Management Tips
Sound risk management matters more than any single entry signal. Consider these general principles as part of your education:
- Position sizing: Size each trade so that a stop-out costs only a small, predefined fraction of your account. A common guideline is to risk no more than 1–2% of account equity per trade. The fixed
Lotsinput does not automatically scale to your balance, so review it carefully. - Understand drawdown: Even a well-designed strategy will have losing streaks. Know the maximum drawdown you are willing to tolerate before you begin, and recognise that historical drawdown figures may be exceeded in live conditions.
- Test on a demo account first: Run the EA on a demo account across a range of market conditions before risking real capital. This lets you observe how it behaves around news, weekends, and changing volatility without financial consequences.
- Account for costs: Spreads, commissions, and slippage all reduce real-world outcomes relative to a backtest. Factor them into any evaluation.
- Never over-leverage: Leverage magnifies both gains and losses. Use it conservatively, and never trade with money you cannot afford to lose.
Risk Warning
Trading foreign exchange, CFDs, and other leveraged financial instruments involves substantial risk of loss and is not suitable for all investors. The strategies and tools discussed on this page are provided for educational purposes only and do not constitute financial advice, investment recommendations, or solicitation to trade. Always consult a qualified financial adviser before making trading decisions. Past backtest performance is not indicative of future results.
Downloads
- Expert Advisor: WickRejectionReversal.ex5 (0 downloads)
- Source Code: WickRejectionReversal.mq5 (0 downloads)
- Documentation: WickRejectionReversal.pdf (0 downloads)