
Disclaimer: This article is for educational and informational purposes only. It does not constitute financial or investment advice. Trading forex and CFDs carries significant risk of loss. Past performance of any strategy — including backtests — does not guarantee future results. Never trade with money you cannot afford to lose.
What Is This Strategy?
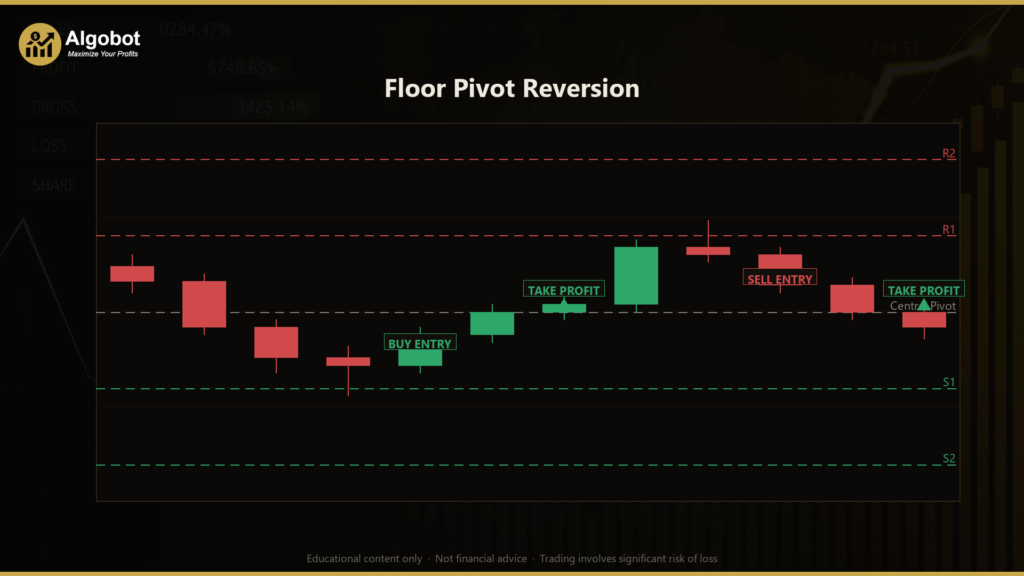
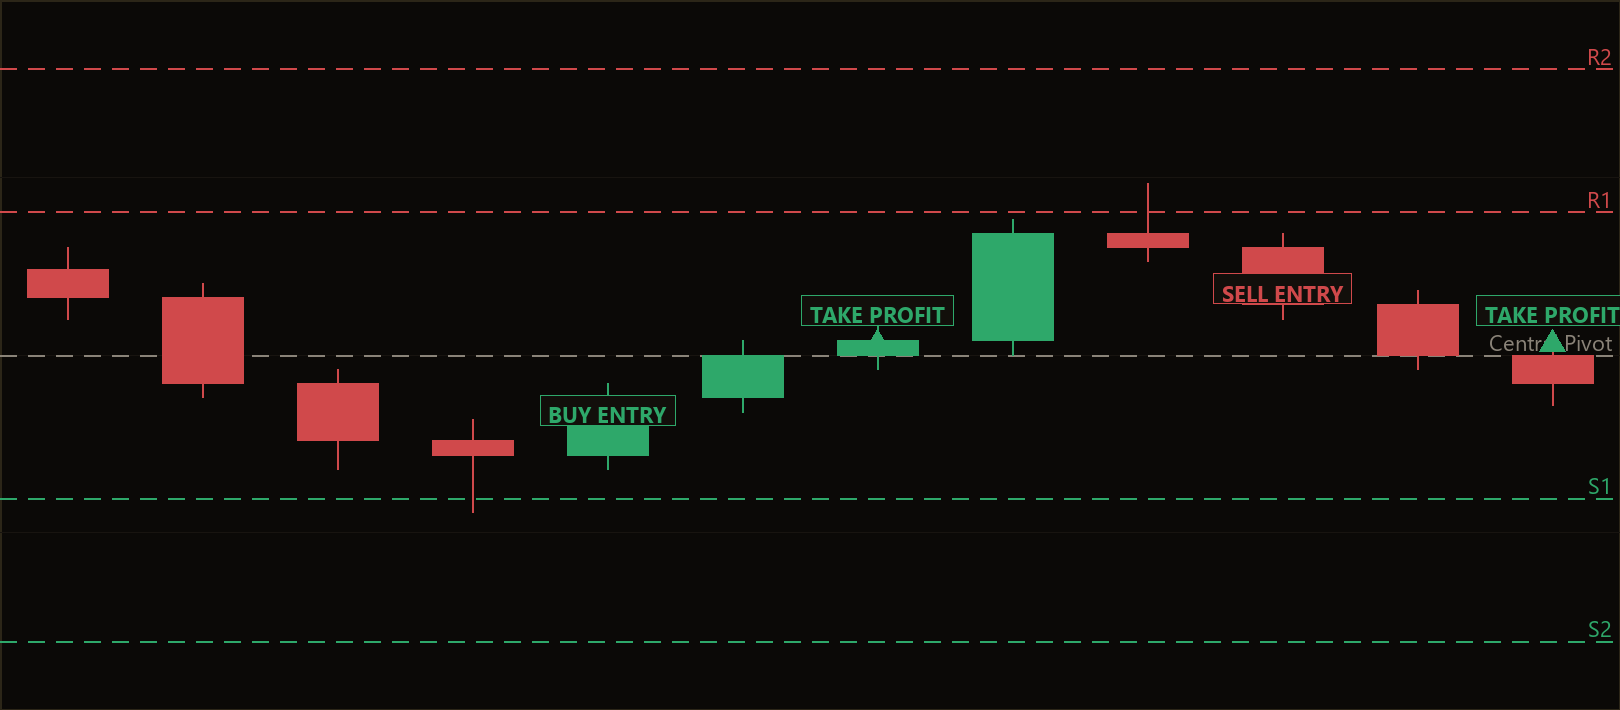
The Floor Pivot Reversion strategy is a pure price-level, mean-reversion system for MetaTrader 5 that trades the classic floor-trader pivot points — a ladder of horizontal support and resistance lines calculated from the previous day's High, Low, and Close. Unlike most expert advisors, it uses no indicators at all: no moving averages, no RSI, no ATR. Everything it does is built around seven static price levels that are computed once at the start of each trading day and then held fixed for the entire session, which makes them non-repainting and easy to reason about.
Pivot points have been used by floor traders for decades because they offer a simple, objective map of where price is statistically likely to find support or resistance. The central pivot (P) is the average of yesterday's High, Low, and Close, and from it the strategy derives three resistance lines (R1, R2, R3) above and three support lines (S3, S2, S1) below. The idea is that intraday price tends to oscillate between adjacent pivot lines, bouncing off one level and drifting toward the next. Floor Pivot Reversion is designed to exploit exactly this oscillation by fading a level — that is, trading against a brief move once a candle shows the level has held.
As a learning tool, this strategy is well suited to traders who want to understand structural, level-based trading without the noise of lagging indicators. It is built for range-bound, intraday conditions on liquid markets and is a good study in how mean-reversion logic, structural take-profit targets, and reward-to-risk filtering fit together. It is framed here as a strategy analysis — a way to study a well-known concept — not as a profit opportunity.
How It Works
The strategy acts only on completed candles (it evaluates the bar that has just closed) and rebuilds its pivot ladder once per day from the previously completed daily bar. The seven levels are sorted into an ascending ladder: S3 < S2 < S1 < P < R1 < R2 < R3. The previous day's range (High − Low) is used as a universal scaling unit, so the touch zone and stop buffer automatically adapt to any symbol or volatility level without ever needing to know the instrument's point size.
Here is what the strategy looks for on each closed candle:
- Long (support held): The strategy signals a long when a bullish candle (close above open) dips down to — or pierces — a pivot level but then closes back above it. This is read as the level acting as support. It scans from the top of the ladder downward to find the highest level the candle touched within the touch zone yet still closed above.
- Short (resistance held): The strategy signals a short when a bearish candle (close below open) spikes up to — or pierces — a pivot level but then closes back below it. This is read as resistance holding. It scans from the bottom of the ladder upward to find the lowest level the candle touched yet still closed below.
- Touch zone: A candle's extreme only counts as a "touch" if it comes within
ZoneFrac× (previous day's range) of the level. This tolerance lets near-misses and small pierces still qualify as a test of the level. - Take-profit (structural target): For a long, the target is the next pivot line up; for a short, it is the next pivot line down. This makes the take-profit a real structural objective — a clean pivot-to-pivot trade — rather than an arbitrary fixed distance. If a trade fires at the very top (R3) or very bottom (S3) of the ladder, the target is extrapolated one equal gap beyond.
- Stop-loss: For a long, the stop is placed just below the held level or the candle's low (whichever is lower), minus a buffer of
StopBufferFrac× (previous day's range). For a short, it is placed just above the level or the candle's high, plus the same buffer. The structural stop and structural target manage the exit — there is no separate trailing logic. - Reward:risk filter: Before any order is sent, the strategy measures the distance to the target (reward) against the distance to the stop (risk). If the ratio is below
MinRewardRisk, the setup is rejected as too tight to be worth taking. - Trade and spread controls: Only one position per magic number is allowed at a time, so a new signal is ignored while a trade is open. New entries are also skipped whenever the current spread exceeds
MaxSpreadPoints, helping avoid entries during costly, illiquid moments.
Strategy Parameters
| Parameter | Default | Min | Max | Description |
|---|---|---|---|---|
| ZoneFrac | 0.05 | 0.01 | 0.20 | How close a candle's extreme must come to a pivot line (as a fraction of the prior day's range) to count as a "touch" of that level. |
| StopBufferFrac | 0.10 | 0.02 | 0.50 | Extra stop buffer placed beyond the held level or signal-candle extreme, as a fraction of the prior day's range. |
| MinRewardRisk | 1.00 | 0.30 | 3.00 | Minimum acceptable reward-to-risk ratio (target distance ÷ stop distance). Setups below this are skipped. |
| MaxSpreadPoints | 100 | 5 | 300 | Skip new entries when the current spread (in points) is wider than this value. |
| Lots | 0.10 | 0.01 | 1.00 | Fixed lot size used for each trade. |
| Magic | 8801 | 0 | 9,999,999 | Unique identifier so the EA only manages its own positions. |
Recommended Chart Settings
This strategy was designed with a liquid FX major such as EURUSD on the M15 (15-minute) timeframe in mind — the textbook home of floor-pivot day-trading. The M15 chart is short enough to capture intraday oscillation between pivot lines but slow enough to avoid much of the noise on lower timeframes. Because the pivot levels are derived from the daily bar, the strategy needs at least two completed daily bars of history to begin.
You can experiment with other liquid instruments and intraday timeframes, but keep in mind that results will vary considerably across different symbols, sessions, and market conditions. Trending or low-volatility environments can behave very differently from the range-bound conditions this mean-reversion approach is built for.
Historical Backtest Results
Note: The figures below are from a historical backtest simulation. Backtests have inherent limitations — they do not account for slippage, requotes, spread widening, or psychological factors. These results should not be interpreted as a prediction of future performance.
No backtest data is available for this strategy yet. When a historical simulation has been run, this section will present the standard performance metrics — Net Profit, Profit Factor, Sharpe Ratio, Win Rate, Maximum Drawdown %, and Total Trades — drawn directly from the simulation output. Until then, no performance figures are claimed, and you are encouraged to run your own backtests across multiple periods and market conditions before drawing any conclusions.
How to Install on MetaTrader 5
- Download the .ex5 file from the link below.
- Copy it to your MT5
MQL5\Expertsfolder. - Restart MetaTrader 5 or refresh the Navigator panel.
- Drag the EA onto a chart matching the recommended symbol and timeframe.
- Configure the input parameters and enable Algo Trading.
What to Consider Before Using This EA
The main strength of the Floor Pivot Reversion approach is its transparency. Because it relies only on static, well-known price levels and no indicators, every decision it makes can be checked by hand: you can plot the pivots yourself and see exactly why a trade did or did not fire. The non-repainting levels, structural pivot-to-pivot targets, range-based scaling, and explicit reward-to-risk filter all reflect disciplined, level-based thinking that is genuinely useful to study.
That said, the approach has real limitations. Mean-reversion systems are vulnerable to strong trends and breakouts — when price breaks decisively through a pivot and keeps going, fading that level can lead to losses, and the strategy will keep its structural stop rather than adapting. Pivot points also work best in liquid, well-behaved markets; on thin instruments or around major news events, levels can be sliced through with little respect. Because only one position is held at a time, the strategy may also sit idle through opportunities while a single trade resolves. The "single candle held the level" signal is deliberately simple, which means it can produce false signals in choppy conditions where a level is tested repeatedly. None of these are reasons to dismiss the strategy — they are simply the conditions under which it may historically underperform, and they are worth understanding before committing to it.
Risk Management Tips
Sound risk management matters far more than any single entry rule. Consider these general principles:
- Position sizing: Size your trades so that a string of losses cannot seriously damage your account. A common educational guideline is to risk no more than 1–2% of account equity per trade.
- Use a demo account first: Test the strategy on a demo account until you fully understand how it behaves across different market conditions before risking real capital.
- Understand drawdown: Every strategy experiences losing streaks. Study the maximum drawdown in your own testing and make sure you could tolerate it both financially and emotionally.
- Account for costs: Spread, slippage, and commissions all erode results. The
MaxSpreadPointsfilter helps, but real-world execution will still differ from idealized backtests. - Diversify and stay realistic: Do not rely on a single strategy or symbol, and treat all historical results as estimates rather than guarantees.
Risk Warning
Trading foreign exchange, CFDs, and other leveraged financial instruments involves substantial risk of loss and is not suitable for all investors. The strategies and tools discussed on this page are provided for educational purposes only and do not constitute financial advice, investment recommendations, or solicitation to trade. Always consult a qualified financial adviser before making trading decisions. Past backtest performance is not indicative of future results.
Downloads
- Expert Advisor: FloorPivotReversion.ex5 (1 downloads)
- Source Code: FloorPivotReversion.mq5 (0 downloads)
- Documentation: FloorPivotReversion.pdf (1 downloads)