Disclaimer: This article is for educational and informational purposes only. It does not constitute financial or investment advice. Trading forex and CFDs carries significant risk of loss. Past performance of any strategy — including backtests — does not guarantee future results. Never trade with money you cannot afford to lose.
What Is This Strategy?
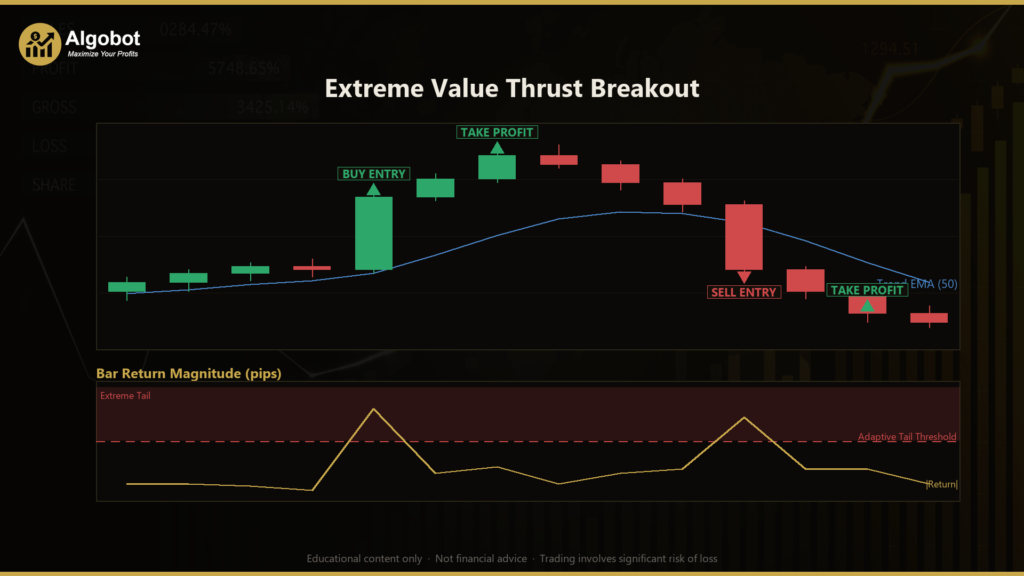
The Extreme Value Thrust Breakout is a momentum-ignition trend strategy that builds its entry trigger from Extreme Value Theory (EVT) — the branch of statistics that models the far tail of a distribution rather than its middle. Most breakout systems call a move "big" when it clears a fixed threshold: an N-pip jump, a candle larger than a set multiple of the Average True Range (ATR), or a Bollinger percent-B band. This strategy takes a different route. It measures how heavy the return tail currently is and lets that measurement shape an adaptive threshold that changes bar by bar.
The logic behind this is intuitive once you see it. A 40-pip bar means something very different in a calm, thin-tailed market than in a wild, fat-tailed one. Rather than assuming a fixed definition of "extreme," the strategy forces each bar to prove it is extreme relative to the tail it actually belongs to. It does this using two classical tools: the Hill estimator, which gauges how fat the tail is, and the Weissman extreme-quantile extrapolation, which projects the return magnitude that should only be exceeded with a small probability. When a just-closed bar's return breaches that adaptive line — and the move agrees with an EMA (Exponential Moving Average) trend filter — the strategy treats it as institutional ignition.
As a learning tool, this strategy is well suited to traders curious about how statistical tail modelling can be applied to price action. It is designed for liquid instruments such as major forex pairs or metals (for example EURUSD or XAUUSD) on intraday timeframes like M15 to H1, and it is written to run on a single timeframe. This article frames it as a strategy analysis — a way to understand adaptive thresholds and momentum continuation — not as a profit opportunity.
How It Works
The strategy operates entirely on closed bars and computes its EMA, ATR, and full EVT tail estimator by hand from raw OHLC data — no external indicator library is used. Here is the sequence it follows on each newly closed bar.
Building the adaptive threshold (per bar):
- It works in log-returns,
r = ln(Close_t / Close_{t-1}), and takes their absolute values as tail magnitudes. - It sorts the last
ReturnWindowabsolute returns and keeps the topk = TailFraction × windowvalues (the "peaks over threshold"). The next value below them,u, becomes the empirical tail cutoff. - The Hill estimator produces a tail index,
xi, from those top-k values. A largexisignals a fat, slowly-decaying tail where huge moves are relatively common; a smallxisignals a thin tail where big moves are genuinely rare. - The Weissman formula,
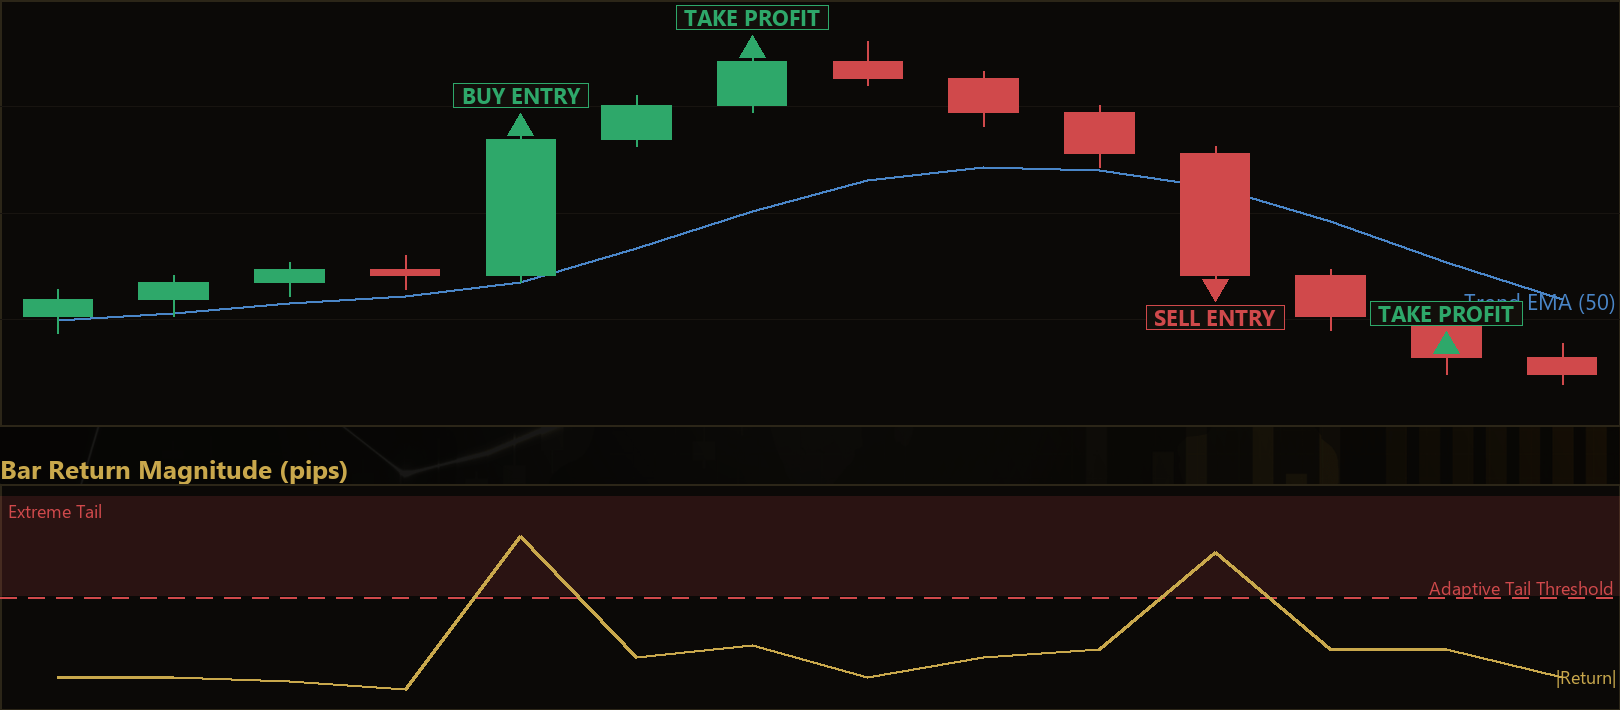
T = u × (k / (window × p))^xi, extrapolates the extreme-quantile thresholdTfor a small exceedance probabilityp(ExceedProb). A fat tail pushesTwell aboveu; a thin tail keeps it nearu. If the tail is degenerate or thin, the strategy falls back toT = u.
Entry conditions (the signal):
- The just-closed bar's absolute return must exceed the adaptive threshold
T— a statistically extreme thrust for the current regime. - The bar must close in its own direction (a bullish body for longs, a bearish body for shorts), so an intrabar fake is filtered out.
- A trend gate must agree: for a long, the EMA must be rising and price must sit above it; for a short, the mirror. A tail thrust with the trend is treated as ignition or continuation; a thrust against the trend is more often exhaustion, so the strategy simply refuses it.
- Long: up-trend + an extreme up-return bar closing bullish → the strategy signals a buy at market.
- Short: down-trend + an extreme down-return bar closing bearish → the strategy signals a sell at market.
Stop-loss logic:
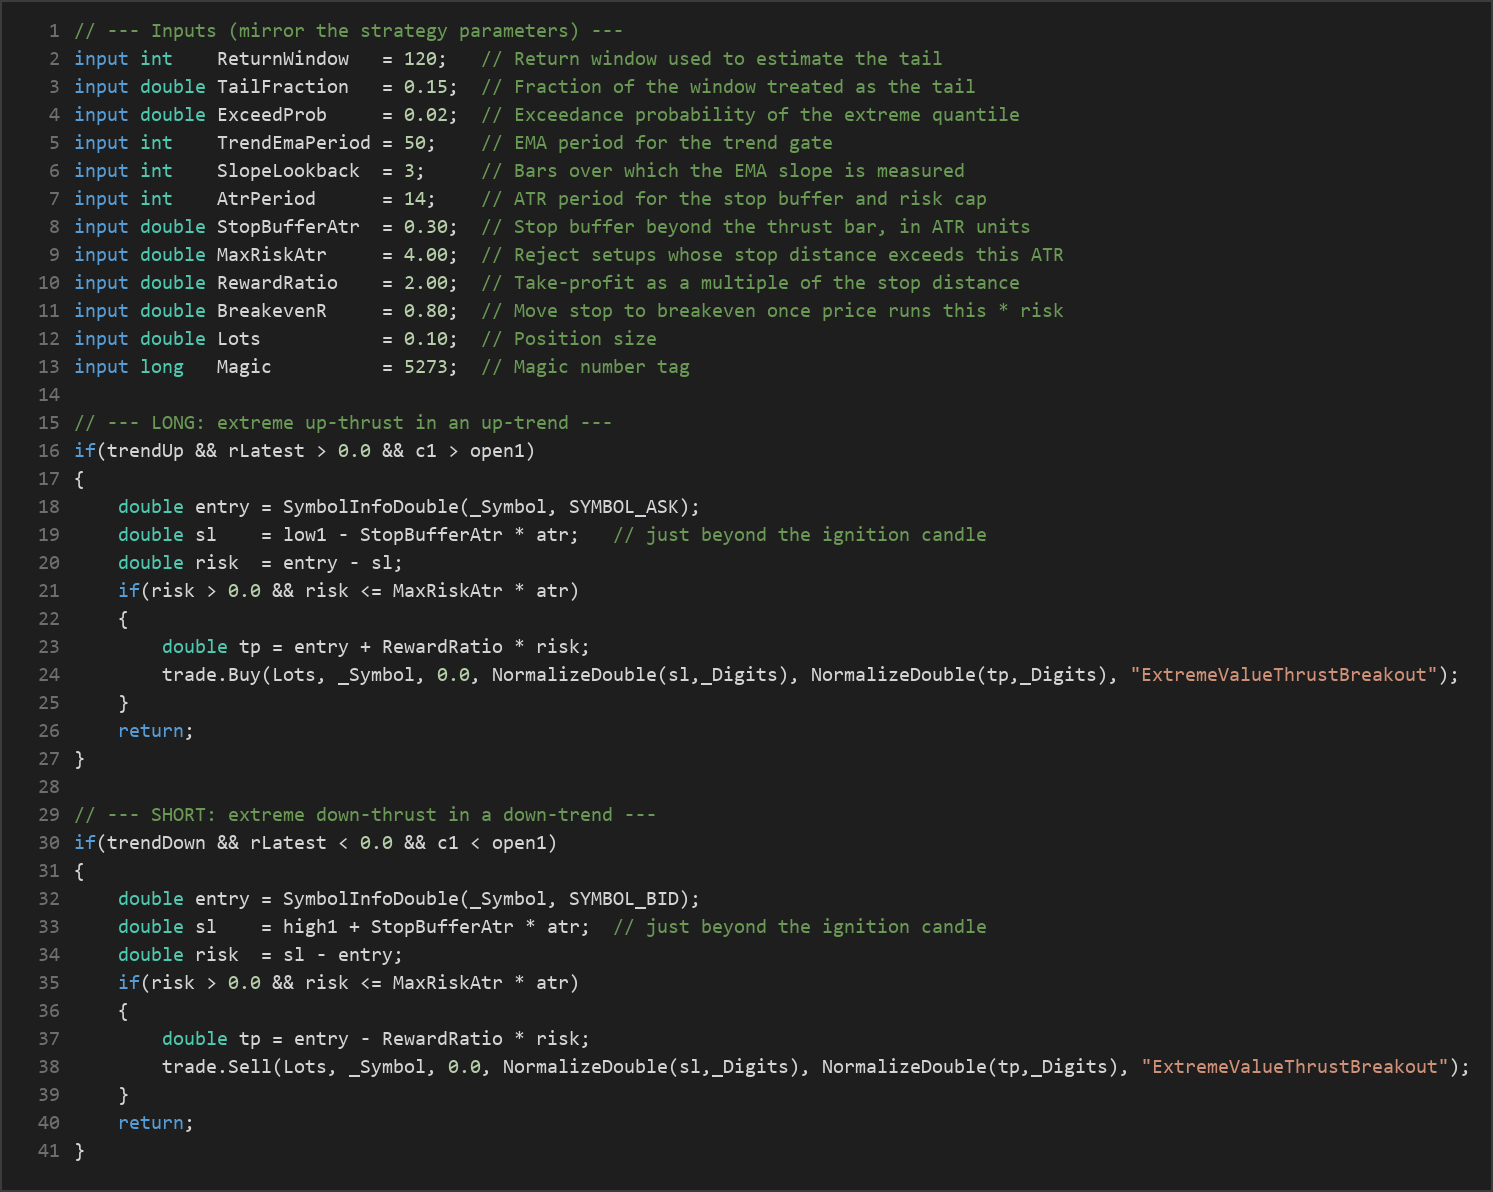
- The stop is placed just beyond the thrust bar's own extreme — its low for longs, its high for shorts — buffered by
StopBufferAtr × ATR. A break back through the ignition candle negates the setup. - Any setup whose stop distance would exceed
MaxRiskAtr × ATRis rejected, bounding the risk taken on any single trade.
Take-profit and trade management:
- The target is set at
RewardRatio ×the structural stop distance. - A breakeven lock pulls the stop to entry once price runs
BreakevenR × riskin favour, so a trade that has moved sufficiently in profit is protected from turning back into a loss. - Only one position per magic number is held at a time — exposure is never stacked.
Strategy Parameters
| Parameter | Default | Min | Max | Description |
|---|---|---|---|---|
| ReturnWindow | 120 | 40 | 300 | Rolling window of past returns used to estimate the tail (the sample EVT sees). |
| TailFraction | 0.15 | 0.05 | 0.35 | Fraction of the window treated as the tail (top order statistics fed to the Hill estimator). |
| ExceedProb | 0.02 | 0.005 | 0.10 | Exceedance probability p that defines the extreme-quantile threshold (smaller = rarer). |
| TrendEmaPeriod | 50 | 10 | 200 | EMA period for the trend gate; only tail thrusts with this trend are traded. |
| SlopeLookback | 3 | 1 | 15 | Bars over which the EMA slope (trend direction) is measured. |
| AtrPeriod | 14 | 5 | 40 | ATR period for the stop buffer and the risk cap. |
| StopBufferAtr | 0.30 | 0.00 | 1.50 | Stop buffer beyond the thrust bar's extreme, in ATR units. |
| MaxRiskAtr | 4.00 | 1.00 | 8.00 | Reject setups whose structural stop distance exceeds this many ATR. |
| RewardRatio | 2.00 | 0.80 | 4.00 | Take-profit distance as a multiple of the structural stop distance. |
| BreakevenR | 0.80 | 0.20 | 2.00 | Move the stop to breakeven once price runs this multiple of risk in favour. |
| Lots | 0.10 | 0.01 | 1.00 | Position size in lots. |
| Magic | 5273 | 0 | 9,999,999 | Magic number tag identifying this strategy's positions. |
Recommended Chart Settings
The Extreme Value Thrust Breakout is timeframe-agnostic because every calculation is driven by the chart it is attached to. It was designed with liquid instruments in mind — major forex pairs or metals such as EURUSD or XAUUSD — on intraday timeframes in the M15 to H1 range, where there is enough bar history to populate the return window meaningfully and where tail events tend to be cleaner. You are free to test other symbols and timeframes, but keep in mind that results will vary across different market conditions, and every instrument has its own tail behaviour that the EVT estimator will adapt to differently.
How to Install on MetaTrader 5
- Download the .ex5 file from the link below
- Copy it to your MT5
MQL5\Expertsfolder - Restart MetaTrader 5 or refresh the Navigator panel
- Drag the EA onto a chart matching the recommended symbol and timeframe
- Configure the input parameters and enable Algo Trading
What to Consider Before Using This EA
Every approach has strengths and trade-offs, and understanding them is part of learning.
Strengths of this approach:
- The adaptive threshold is its defining feature. Because the "extreme" line is recomputed from the current tail, the strategy naturally becomes more demanding in volatile regimes and more sensitive in calm ones — something a fixed pip or ATR threshold cannot do.
- Requiring the thrust to agree with the trend gate filters out many counter-trend spikes that are frequently exhaustion moves.
- The structural stop, the per-trade risk cap, and the breakeven lock are all aimed at a controlled, low-drawdown risk profile rather than aggressive exposure.
Known limitations:
- EVT estimation is data-hungry. The Hill estimator can be noisy when the tail sample is small, so very short return windows or unusual
TailFractionsettings may produce unstable thresholds. - As a trend-following, momentum-continuation system, it can underperform in choppy, range-bound markets where extreme bars are followed by immediate reversals rather than continuation.
- A tight structural stop just beyond the ignition candle means that even valid setups can be stopped out on the retest that often follows a large bar.
- News-driven spikes can trip the threshold; the trend gate helps, but no filter is perfect around scheduled events.
Treat this EA as a way to study how tail statistics interact with momentum, not as a finished solution. Parameter choices interact in subtle ways, and thoughtful testing is essential.
Risk Management Tips
Sound risk management matters far more than any single entry rule. As a general education-focused framework:
- Size positions conservatively. A common guideline is to risk no more than 1–2% of account equity on any single trade. Adjust the
Lotsparameter to match your account size and the instrument's stop distance. - Use a demo account first. Run the strategy on a demo or on historical data across a range of market conditions before considering any live use, so you understand how it behaves in trends, ranges, and volatile spikes.
- Understand drawdown. Even a system engineered for low drawdown will experience losing streaks. Know the largest peak-to-trough decline you are willing to tolerate before you begin.
- Keep the risk cap sensible. The
MaxRiskAtrparameter exists to bound per-trade risk — lowering it makes the strategy more selective, while raising it admits wider, riskier stops. - Never rely on a single strategy or single instrument. Diversification and ongoing review are part of prudent trading practice.
Risk Warning
Trading foreign exchange, CFDs, and other leveraged financial instruments involves substantial risk of loss and is not suitable for all investors. The strategies and tools discussed on this page are provided for educational purposes only and do not constitute financial advice, investment recommendations, or solicitation to trade. Always consult a qualified financial adviser before making trading decisions. Past backtest performance is not indicative of future results.
Downloads
- Expert Advisor: ExtremeValueThrustBreakout.ex5 (22 downloads)
- Source Code: ExtremeValueThrustBreakout.mq5 (26 downloads)
- Documentation: ExtremeValueThrustBreakout.pdf (40 downloads)