Disclaimer: This article is for educational and informational purposes only. It does not constitute financial or investment advice. Trading forex and CFDs carries significant risk of loss. Past performance of any strategy — including backtests — does not guarantee future results. Never trade with money you cannot afford to lose.
What Is This Strategy?
The Wavelet Energy Trend Rider is a regime-gated trend-following expert advisor (EA) for MetaTrader 5 built around a multi-scale Haar wavelet transform of recent closing prices. A wavelet transform is a signal-processing tool that decomposes a price series into fluctuations at different time scales — from bar-to-bar wiggle at the finest scale up to broad, slow swings at the coarsest scale. Instead of relying on a moving-average crossover, an oscillator, or an efficiency ratio, this strategy studies where the market's energy is concentrated across those scales, and uses that distribution to decide whether the market is trending or simply chopping sideways.
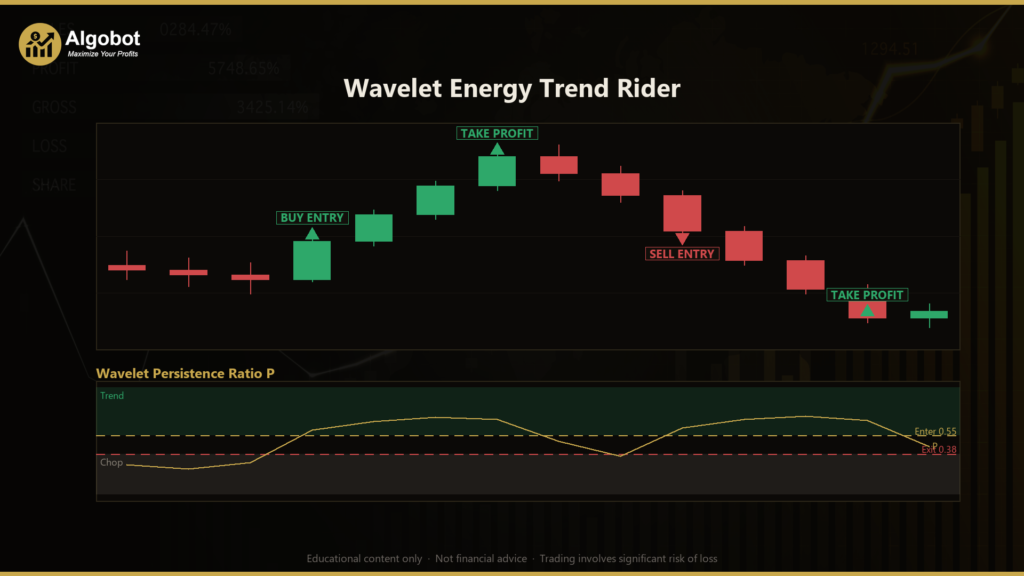
The core idea rests on a mathematical property called Parseval's theorem, which states that the total squared "detail" energy from the wavelet transform equals the total fluctuation energy of the price window. The strategy partitions that energy into a fine portion (the two highest-frequency, noise-like scales) and a coarse portion (all the lower-frequency, trend-like scales). From those it computes a scale-invariant Persistence ratio (P) between 0 and 1. For random, noisy price action, energy spreads out and P sits near 0.25. When a clean directional move develops, coarse swing energy dominates and P climbs well above 0.5.
This strategy is best suited to traders who want to study how signal-processing concepts can be applied to markets, and who are curious about regime detection that does not depend on conventional indicators. It is designed for liquid forex pairs and index CFDs on intraday timeframes such as M15 to H1, though it is not locked to any single instrument. Treat it as a learning tool for exploring how a trend can be identified as it is born rather than after it has matured.
How It Works
The strategy processes one completed bar at a time. On each new bar it rebuilds the wavelet decomposition, updates the Persistence ratio, and checks its entry and exit rules. Direction is taken from the wavelet's low-frequency content: the mean of the newest half of the window minus the mean of the oldest half. A positive difference implies up-structure; a negative difference implies down-structure.
Entry conditions — the strategy signals a trade when:
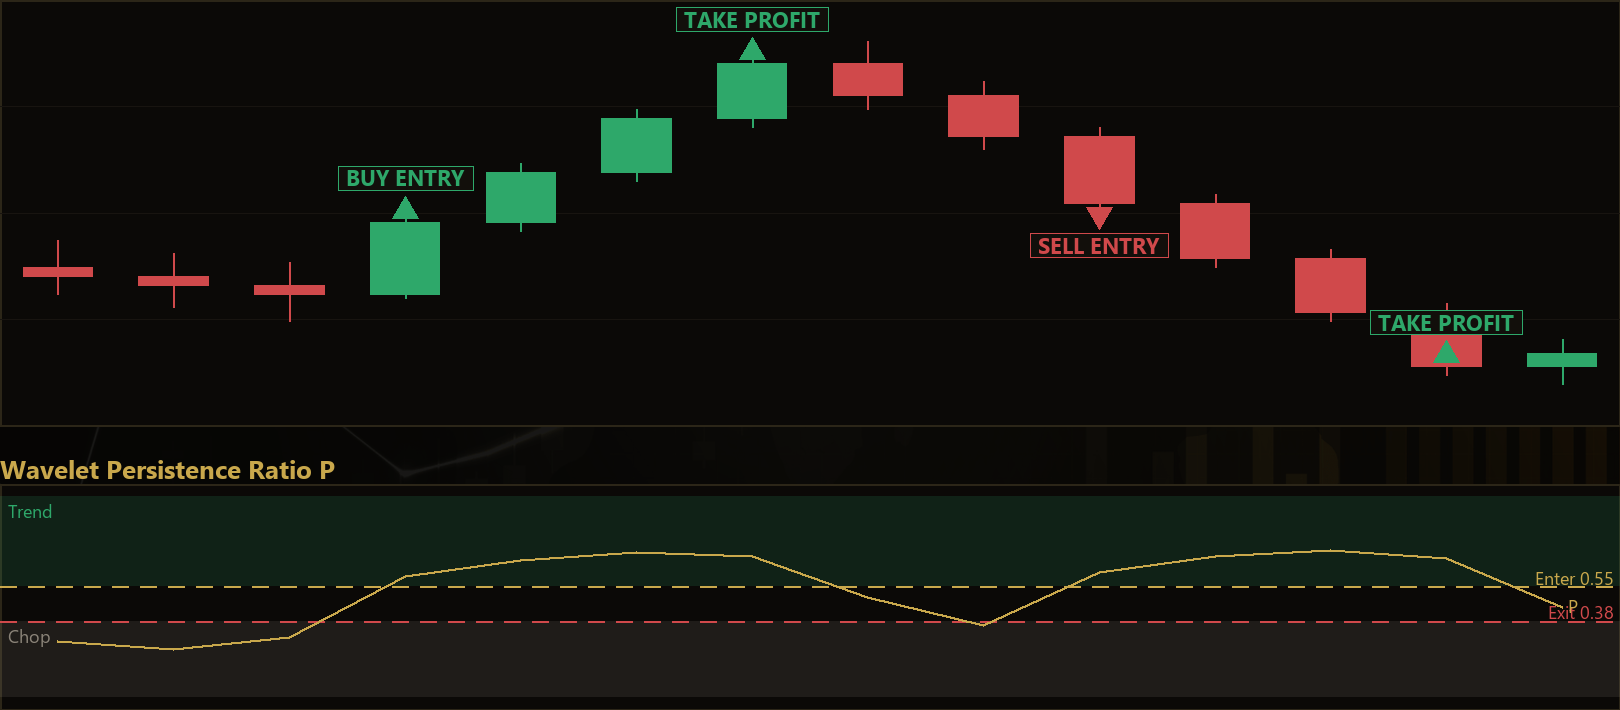
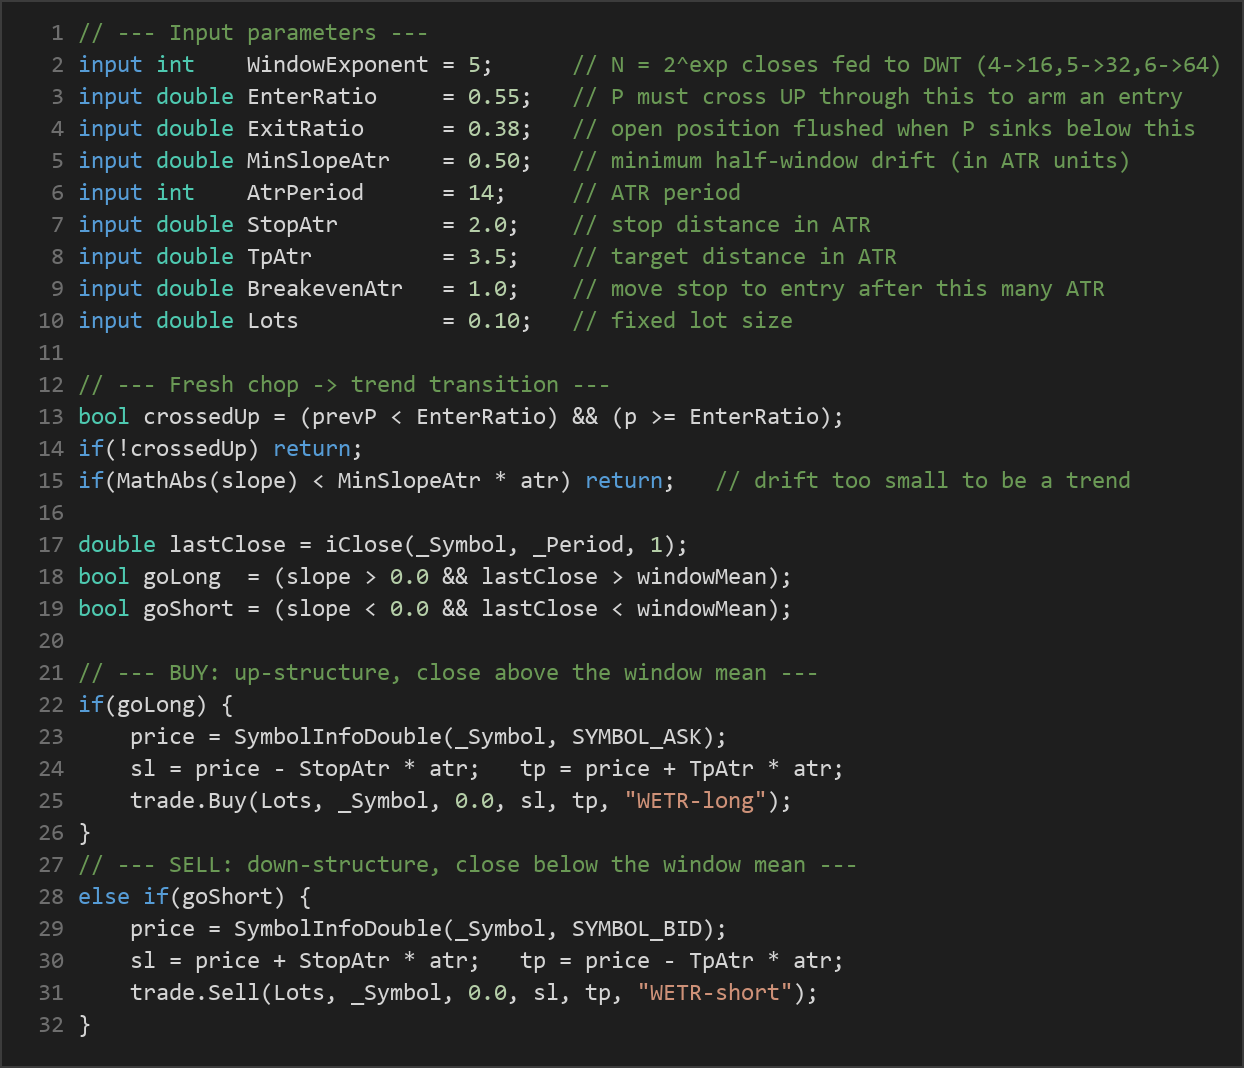
- The Persistence ratio crosses up through the
EnterRatiothis bar (it was below the threshold last bar). This "fresh transition" captures the chop-to-trend moment rather than chasing an already-extended move. - The half-window drift is large enough relative to volatility: the absolute slope must exceed
MinSlopeAtr× ATR, filtering out technically-trending-but-flat noise. - For a long, the structure must be up (positive slope) and the latest close must be above the window mean.
- For a short, the structure must be down (negative slope) and the latest close must be below the window mean.
Exit conditions — the strategy manages open positions with three layers:
- ATR stop-loss: every trade is bracketed by a protective stop placed
StopAtr× ATR away from entry. ATR (Average True Range) measures recent volatility, so the stop adapts to market conditions. - ATR take-profit: a target is placed
TpAtr× ATR from entry. - Regime-loss exit: if the Persistence ratio falls back below
ExitRatio, the coarse trend structure is considered dissolved and the position is closed early — before the stop is necessarily hit. - Breakeven lock (optional): once price advances
BreakevenAtr× ATR in favour of the trade, the stop is moved to the entry price to protect an advanced position.
Only one position per magic number is held at a time, and the bracket plus regime exit own every close. This layered exit design is intended to keep adverse excursion — and therefore drawdown — shallow.
Strategy Parameters
| Parameter | Default | Min | Max | Description |
|---|---|---|---|---|
| WindowExponent | 5 | 4 | 6 | Window length exponent: N = 2^exp completed closes fed to the wavelet transform (4 → 16 bars, 5 → 32, 6 → 64). Power-of-two is required by the Haar transform. |
| EnterRatio | 0.55 | 0.45 | 0.75 | The Persistence ratio must cross up through this level to arm a fresh chop-to-trend entry. |
| ExitRatio | 0.38 | 0.25 | 0.50 | An open position is flushed when the Persistence ratio sinks back below this (structure gone). |
| MinSlopeAtr | 0.50 | 0.0 | 2.0 | Minimum half-window drift (in ATR units) required for a valid trend, rejecting flat transitions. |
| AtrPeriod | 14 | 7 | 28 | Number of bars used to compute the ATR volatility measure. |
| StopAtr | 2.0 | 1.0 | 4.0 | Stop-loss distance expressed in ATR multiples. |
| TpAtr | 3.5 | 1.5 | 6.0 | Take-profit distance expressed in ATR multiples. |
| BreakevenAtr | 1.0 | 0.0 | 3.0 | Move the stop to entry once price advances this many ATR (0 disables the breakeven lock). |
| Lots | 0.10 | 0.01 | 1.0 | Fixed lot size per trade. |
Recommended Chart Settings
The Wavelet Energy Trend Rider was designed with liquid forex pairs and major index CFDs in mind, on intraday timeframes in the M15 to H1 range, where trend and chop regimes alternate cleanly enough for the wavelet gate to discriminate between them. Because the Persistence ratio is a pure, scale-invariant ratio, it needs no price-level normalization and adapts across instruments — but that does not mean every instrument will behave identically.
The strategy runs on whatever symbol and timeframe you attach it to; it is never locked to a single chart. As with any approach, results will vary across different market conditions, instruments, and broker data feeds. Always test on the specific symbol and timeframe you intend to study before drawing any conclusions.
How to Install on MetaTrader 5
- Download the
.ex5file from the link below. - Copy it to your MT5
MQL5\Expertsfolder. - Restart MetaTrader 5 or refresh the Navigator panel.
- Drag the EA onto a chart matching the recommended symbol and timeframe.
- Configure the input parameters and enable Algo Trading.
What to Consider Before Using This EA
Strengths of this approach. The wavelet energy gate offers a genuinely different lens on regime detection. Because it measures the shape of fluctuation across scales rather than absolute price movement, the Persistence ratio requires no volatility scaling and behaves consistently across instruments. Entering on the fresh chop-to-trend crossover, rather than chasing a mature move, is intended to give favourable entries with shallow adverse excursion. The three-layer exit — ATR bracket, regime-loss exit, and optional breakeven lock — reflects a deliberate low-drawdown design philosophy.
Known limitations. The Haar wavelet is the simplest possible wavelet basis; it is computationally clean but blocky, and it may not resolve every nuance of price structure. The transform operates on a fixed power-of-two window (16, 32, or 64 bars), so very short or very long-cycle behaviour outside that window is invisible to the gate. Like all trend-following logic, the strategy can generate false transitions and whipsaw losses during choppy, range-bound markets — precisely the conditions where the "fresh transition" trigger may fire and then quickly reverse. The regime-loss exit is meant to cut those losses early, but it can also exit a valid trade prematurely during a normal pullback.
Where it may underperform. Sideways markets, low-liquidity sessions, and news-driven volatility spikes can all produce misleading energy distributions. During strong but noisy trends, the Persistence ratio may oscillate around the entry and exit thresholds, producing repeated entries and exits. Treat this EA as an educational study of wavelet-based regime detection — not as a turnkey solution. Careful forward-testing on a demo account is essential before you rely on any of its signals.
Risk Management Tips
Sound risk management matters far more than any single indicator. Consider these general principles as you study this strategy:
- Position sizing: size each trade so that a full stop-loss represents only a small fraction of your account. A common educational guideline is to risk no more than 1–2% of your account balance per trade.
- Use a demo account first: test the EA thoroughly on a demo account across varied market conditions before considering any live use. This lets you understand its behaviour without financial exposure.
- Understand drawdown: even a well-designed strategy will experience losing streaks. Study the historical drawdown so you know what a normal losing sequence looks like and can decide whether you could tolerate it.
- Respect the ATR stop: the ATR-based stop adapts to volatility, but wider stops in volatile conditions mean larger potential losses per trade. Adjust your lot size accordingly.
- Diversify and avoid over-leverage: never concentrate excessive capital in a single strategy or instrument, and be cautious with leverage, which magnifies both gains and losses.
Education, patience, and disciplined risk control are the foundation of responsible trading. No parameter set removes the underlying risk of the market.
Risk Warning
Trading foreign exchange, CFDs, and other leveraged financial instruments involves substantial risk of loss and is not suitable for all investors. The strategies and tools discussed on this page are provided for educational purposes only and do not constitute financial advice, investment recommendations, or solicitation to trade. Always consult a qualified financial adviser before making trading decisions. Past backtest performance is not indicative of future results.
Downloads
- Expert Advisor: WaveletEnergyTrendRider.ex5 (24 downloads)
- Source Code: WaveletEnergyTrendRider.mq5 (23 downloads)
- Documentation: WaveletEnergyTrendRider.pdf (33 downloads)