Disclaimer: This article is for educational and informational purposes only. It does not constitute financial or investment advice. Trading forex and CFDs carries significant risk of loss. Past performance of any strategy — including backtests — does not guarantee future results. Never trade with money you cannot afford to lose.
What Is This Strategy?
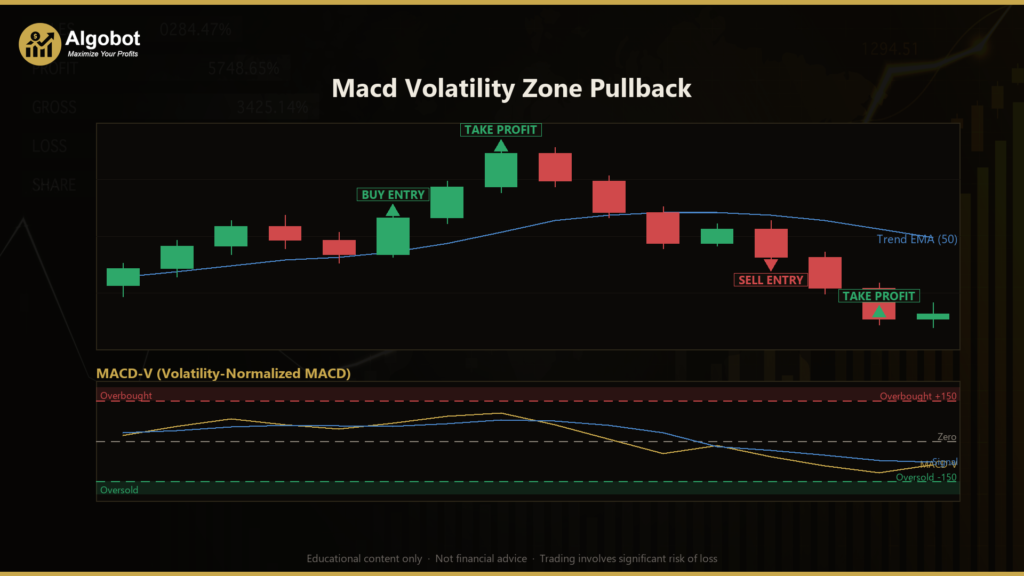
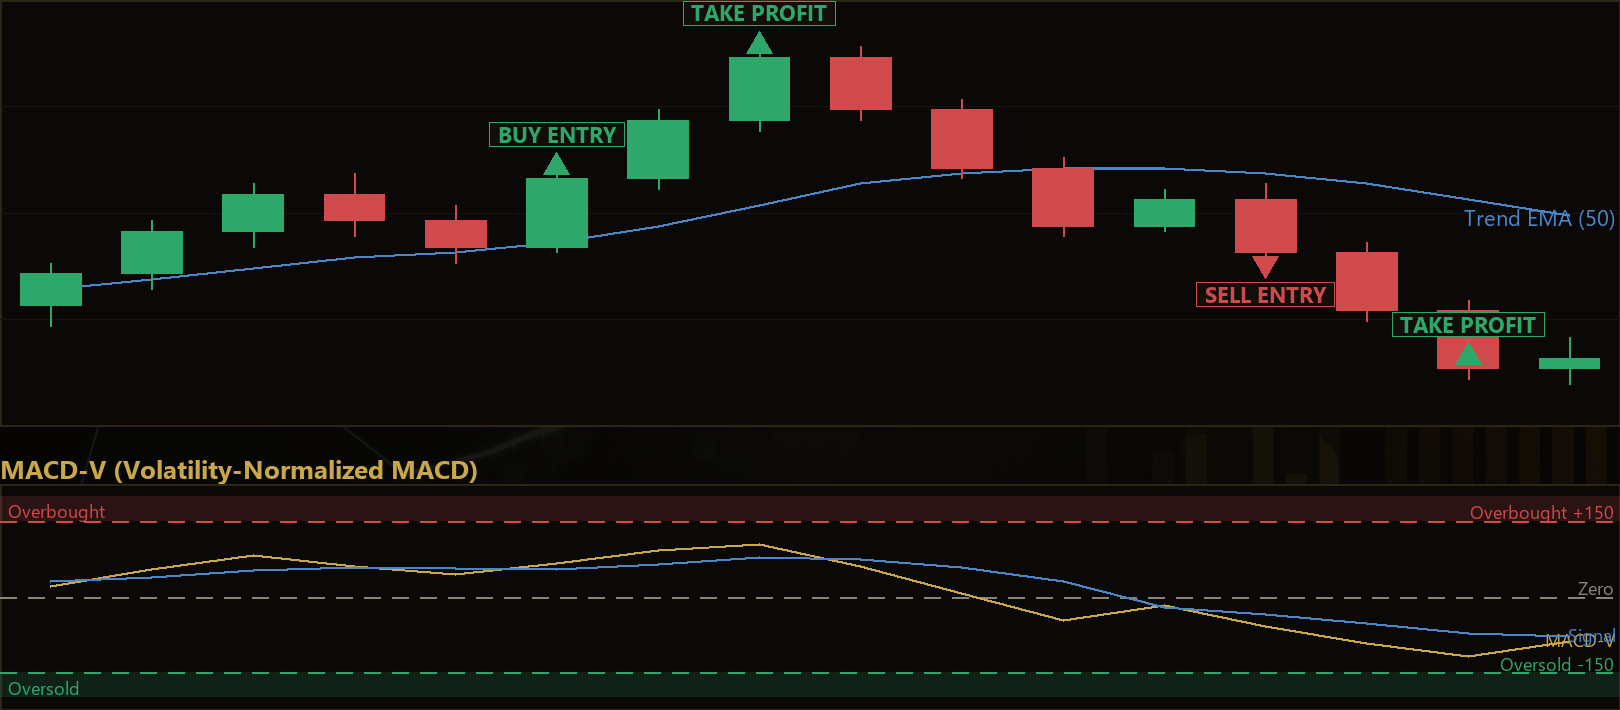
The Macd Volatility Zone Pullback strategy is a with-trend, momentum-reset continuation system built around a volatility-normalized MACD — an indicator often called MACD-V. Traditional MACD (Moving Average Convergence Divergence) measures the gap between two exponential moving averages in raw price units, which means the same reading can signal something very different in a calm market than in a wild one. MACD-V solves that by dividing the MACD line by the Average True Range (ATR) — a standard measure of recent volatility — and scaling the result by 100. The oscillator then lives on a stable, regime-independent scale where positive values indicate bullish momentum, negative values indicate bearish momentum, and a symmetric overbought/oversold band flags exhaustion.
Rather than trading a plain MACD crossover, this strategy is designed to catch the momentum reset inside an already-established trend. It waits for a trend to be in place, waits for momentum to cool off during a pullback, and then looks for that momentum to resume in the trend's direction. This makes it a "buy-the-dip in an uptrend, sell-the-rally in a downtrend" continuation approach rather than a reversal or breakout tool.
As a learning resource, the Macd Volatility Zone Pullback is well suited to traders who want to study how normalization can make a classic oscillator more comparable across time and instruments, and how multiple filters (trend, regime, trigger, and exhaustion) can be layered to reduce noise. It was designed with liquid forex pairs and index CFDs on intraday timeframes in mind, but the logic is not hardcoded to any single symbol.
How It Works
The strategy only evaluates signals on a freshly closed bar, which avoids acting on the noise of an unfinished candle. Every condition below is checked on that just-closed bar.
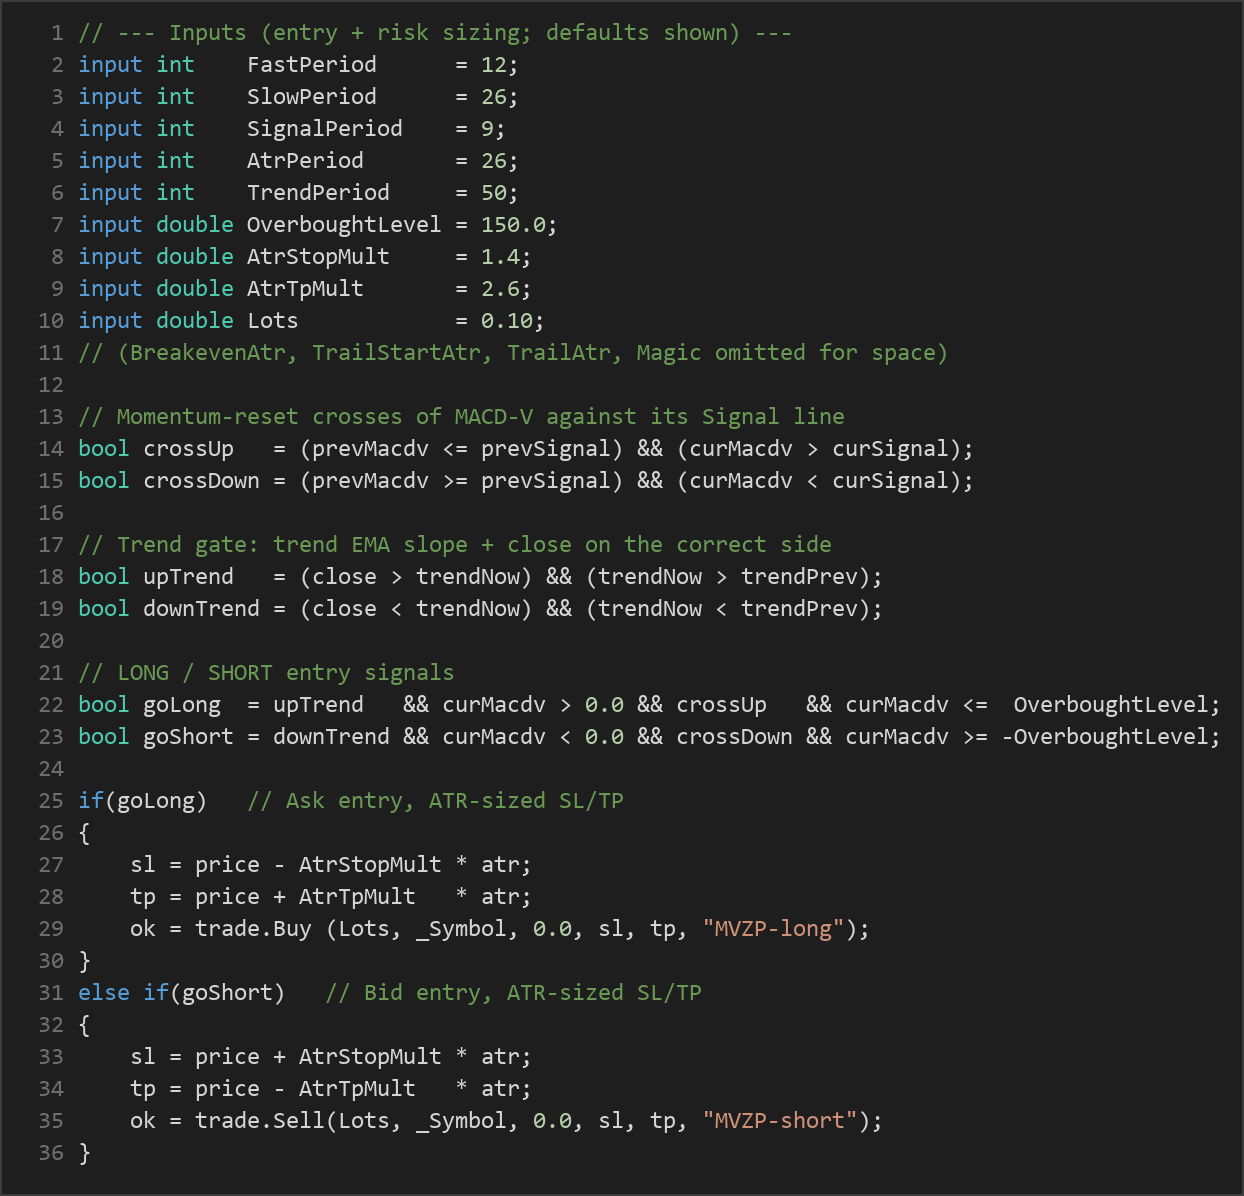
Long entry — the strategy signals a long when all of the following hold:
- Trend gate: The trend EMA (an exponential moving average of closing price over
TrendPeriod) is rising, and the close is above it. This confirms an established uptrend. - Regime filter: MACD-V is above zero, meaning momentum is on the bullish side.
- Reset trigger: MACD-V crosses back above its signal line. This represents a cooled-off pullback in momentum resuming with the trend.
- Not exhausted: MACD-V is at or below the
OverboughtLevel, so the strategy never chases an already-overextended move.
Short entry — the exact mirror image:
- The trend EMA is falling and the close is below it.
- MACD-V is below zero.
- MACD-V crosses back below its signal line.
- MACD-V is at or above the negative
OverboughtLevel.
Exit and risk logic:
- ATR stop-loss: When a trade opens, the stop is placed
AtrStopMult × ATRaway from entry, sizing risk to current volatility. - ATR take-profit: A target is placed
AtrTpMult × ATRaway from entry, giving a volatility-scaled reward objective. - Break-even lock: Once price moves
BreakevenAtr × ATRin the trade's favour, the stop is pulled up (or down) to the entry price to protect against giving back gains. - ATR trailing stop: After price advances
TrailStartAtr × ATR, a trailing stop begins following price at a distance ofTrailAtr × ATR. It only ever ratchets in the trade's favour — it never loosens. - Regime-flip exit: If MACD-V crosses back through zero against the open position, the trend thesis is considered broken and the position is closed immediately rather than waiting for the stop.
- Single position at a time: The strategy holds only one position and never stacks entries.
Strategy Parameters
| Parameter | Default | Min | Max | Description |
|---|---|---|---|---|
| FastPeriod | 12 | 5 | 20 | Period of the fast EMA in the MACD calculation. |
| SlowPeriod | 26 | 15 | 60 | Period of the slow EMA in the MACD calculation (auto-adjusted to always exceed the fast period). |
| SignalPeriod | 9 | 4 | 20 | Period of the EMA applied to MACD-V to form the signal line. |
| AtrPeriod | 26 | 10 | 50 | Lookback for the ATR used to normalize MACD and size stops/targets. |
| TrendPeriod | 50 | 20 | 200 | Period of the trend-filter EMA that defines the prevailing direction. |
| OverboughtLevel | 150.0 | 80.0 | 250.0 | MACD-V exhaustion threshold; entries are skipped beyond this level. |
| AtrStopMult | 1.4 | 0.8 | 3.0 | Stop-loss distance as a multiple of ATR. |
| AtrTpMult | 2.6 | 1.2 | 5.0 | Take-profit distance as a multiple of ATR. |
| BreakevenAtr | 1.0 | 0.3 | 2.5 | Gain (in ATR multiples) required before the stop moves to break-even. |
| TrailStartAtr | 1.4 | 0.5 | 3.0 | Gain (in ATR multiples) required before the trailing stop activates. |
| TrailAtr | 1.2 | 0.5 | 3.0 | Trailing-stop distance behind price, as a multiple of ATR. |
| Lots | 0.10 | 0.01 | 1.0 | Fixed trade size in lots. |
Recommended Chart Settings
The Macd Volatility Zone Pullback was designed with liquid forex pairs and index CFDs in mind, on intraday timeframes such as M15 to H1. Because every calculation uses the chart's primary timeframe, nothing is hardcoded — you can attach it to whatever symbol and timeframe your testing suggests. Trending, liquid markets tend to suit a continuation approach like this best; choppy or range-bound conditions are where such strategies are historically most challenged. Remember that results will vary across different symbols, brokers, spreads, and market conditions, so any settings should be validated on your own data before being relied upon.
How to Install on MetaTrader 5
- Download the .ex5 file from the link below
- Copy it to your MT5
MQL5\Expertsfolder - Restart MetaTrader 5 or refresh the Navigator panel
- Drag the EA onto a chart matching the recommended symbol and timeframe
- Configure the input parameters and enable Algo Trading
What to Consider Before Using This EA
Strengths of the approach. The core idea — normalizing MACD by ATR — addresses a genuine weakness of the classic indicator: raw MACD readings are not comparable across volatility regimes or across instruments. By expressing momentum on a stable scale, the strategy can apply consistent thresholds. The layered filters (trend direction, momentum regime, reset trigger, and an exhaustion cap) work together to demand that several conditions agree before a trade is taken, which historically helps filter out lower-quality signals. The conservative risk framework — ATR-based stops, break-even locking, trailing, and an immediate regime-flip exit — is built to keep individual losses contained.
Known limitations. Every filter that improves signal quality also reduces the number of trades and can introduce lag. Because entries require a pullback and a momentum resumption and a rising/falling trend EMA, the strategy may sit out extended stretches, and it can enter late in a move. Like all trend-continuation systems, it is vulnerable to whipsaws in sideways markets, where MACD-V oscillates around zero and repeatedly triggers the regime-flip exit. The overbought cap that prevents chasing extended moves can also cause the strategy to miss the strongest, most persistent trends. ATR-based stops adapt to volatility but can be wide during turbulent conditions, and a fixed lot size does not scale risk to account equity.
Where it may underperform. Low-volatility ranging markets, news-driven spikes, and instruments with wide or unstable spreads are all environments where a momentum-reset continuation strategy may struggle. This EA is best understood as a study in disciplined trend-following mechanics — not a set-and-forget solution.
Risk Management Tips
Sound risk management matters more than any single entry signal. Consider these general principles as part of your education:
- Risk only a small fraction per trade. Many educational sources suggest never risking more than 1–2% of account equity on a single position. With a fixed lot size, you may need to adjust
Lotsso that the ATR-based stop distance keeps your per-trade risk within that band. - Understand drawdown. Even a well-designed strategy will experience losing streaks. Study the maximum historical drawdown before committing capital, and ask whether you could tolerate it emotionally and financially.
- Start on a demo account. Test the EA in a risk-free simulated environment first, across different market conditions, until you understand how it behaves before considering any live use.
- Mind costs. Spreads, commissions, slippage, and swap fees all erode results — especially for a strategy that trades frequently or uses tight ATR distances.
- Diversify and avoid over-leverage. Concentrating risk in one instrument or using excessive leverage magnifies losses as easily as gains.
- Keep expectations realistic. No parameter set guarantees any particular outcome; backtests describe the past, not the future.
Risk Warning
Trading foreign exchange, CFDs, and other leveraged financial instruments involves substantial risk of loss and is not suitable for all investors. The strategies and tools discussed on this page are provided for educational purposes only and do not constitute financial advice, investment recommendations, or solicitation to trade. Always consult a qualified financial adviser before making trading decisions. Past backtest performance is not indicative of future results.
Downloads
- Expert Advisor: MacdVolatilityZonePullback.ex5 (50 downloads)
- Source Code: MacdVolatilityZonePullback.mq5 (47 downloads)
- Documentation: MacdVolatilityZonePullback.pdf (45 downloads)