Disclaimer: This article is for educational and informational purposes only. It does not constitute financial or investment advice. Trading forex and CFDs carries significant risk of loss. Past performance of any strategy — including backtests — does not guarantee future results. Never trade with money you cannot afford to lose.
What Is This Strategy?
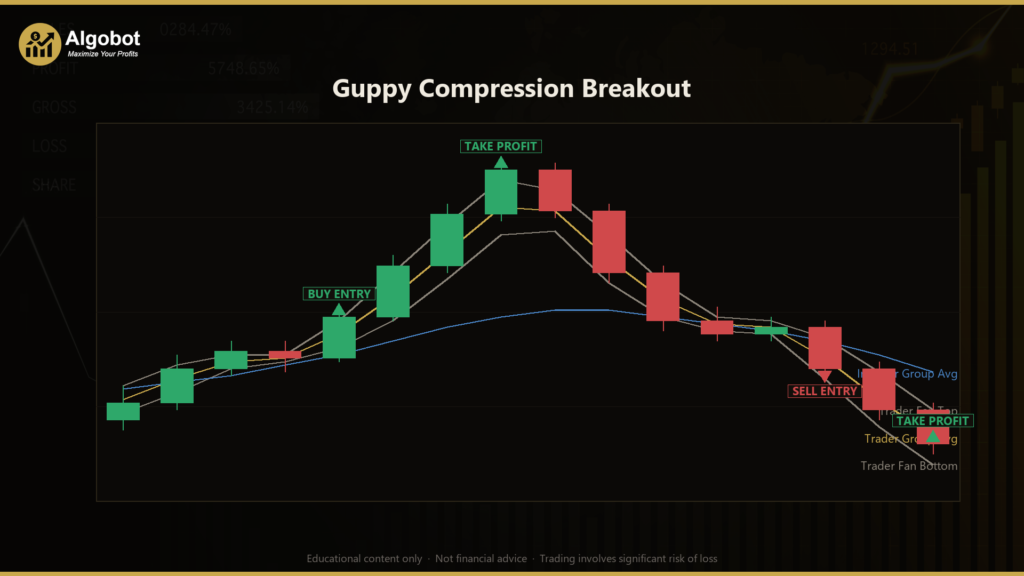
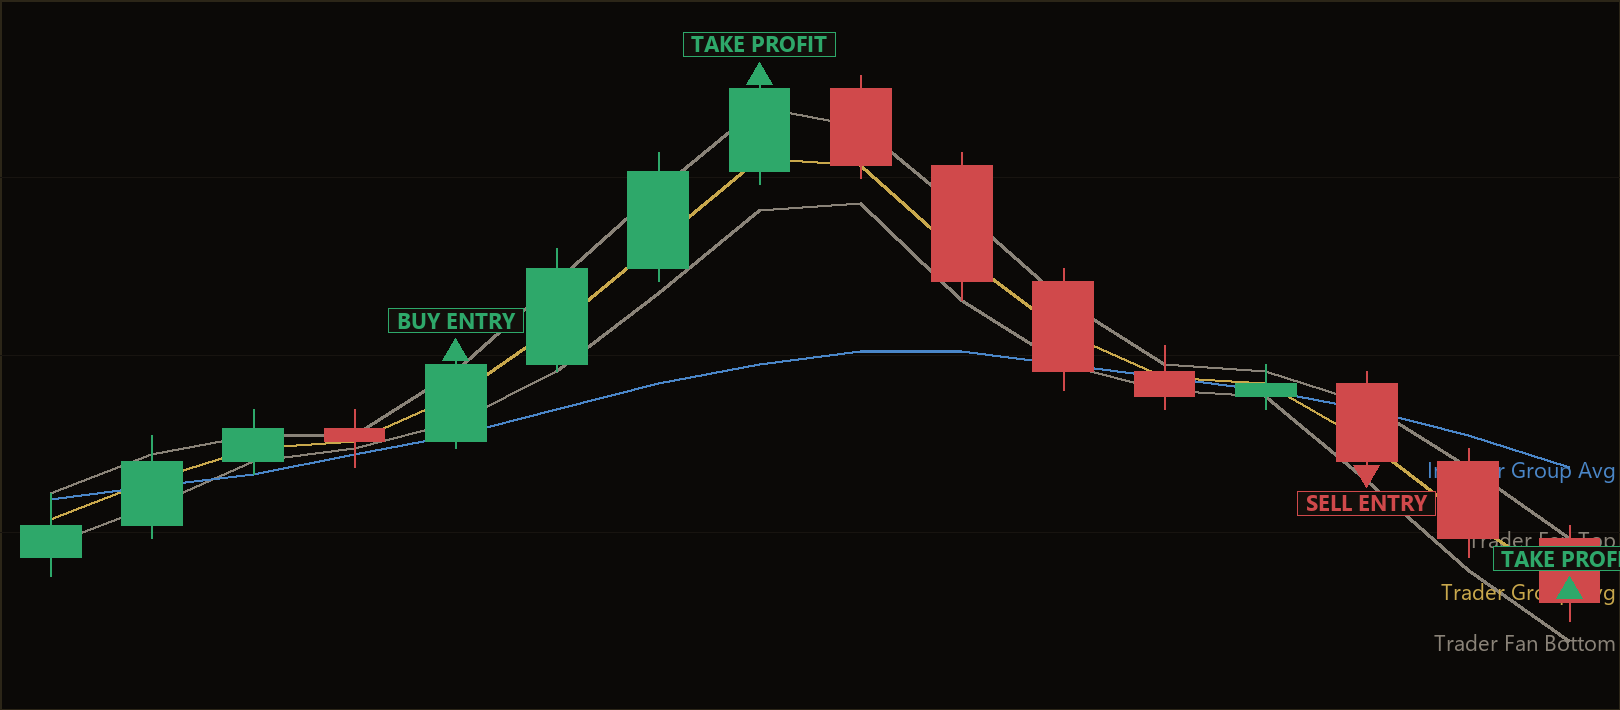
The Guppy Compression Breakout is a trend-following re-ignition strategy built on Daryl Guppy's Multiple Moving Average (GMMA) — a tool that plots two groups of exponential moving averages (EMAs) on the closing price rather than relying on a single line. The first group is a fast set of "trader" EMAs (periods 3, 5, 8, 10, 12 and 15), and the second is a slow set of "investor" EMAs (periods 30, 35, 40, 45, 50 and 60). An EMA is a moving average that weights recent prices more heavily than older ones, so it reacts faster to fresh price action than a simple average.
The insight behind the GMMA is that no single line matters — what matters is the behaviour of the two groups relative to each other. When the fast group sits well above the slow group and both fan out, an uptrend is considered healthy. During that trend the fast "trader" group periodically compresses (its EMAs bunch tightly together) as a small counter-trend pullback drains momentum, then fans open again as the crowd re-commits in the direction of the slower, more stable investor group. This strategy is designed to detect that "squeeze then fan" moment and treat it as a continuation signal rather than a blind breakout.
As a learning tool, this approach suits traders who want to study how trend continuation can be structured around indicator geometry — separation, compression and expansion — instead of a single crossover. It is intended for educational analysis of trending markets and is best studied on instruments that tend to trend, such as major FX pairs or metals. It is not a shortcut and not a profit opportunity; it is a framework for understanding how multi-layered moving averages describe crowd behaviour.
How It Works
The strategy evaluates its rules once per newly closed bar. It measures the internal spread of the fast trader group as the distance between its widest and narrowest EMA (max EMA − min EMA), then divides that by the Average True Range (ATR) — a volatility measure — so the compression and expansion thresholds behave the same across different symbols and timeframes.
The strategy signals a long entry when all of the following align:
- The investor (slow) group is rising — its average value is higher now than it was
SlopeBarsbars ago. - Bullish alignment is present — the fast group's average sits above the slow group's average.
- The trader fan recently compressed — the ATR-normalised spread dropped below
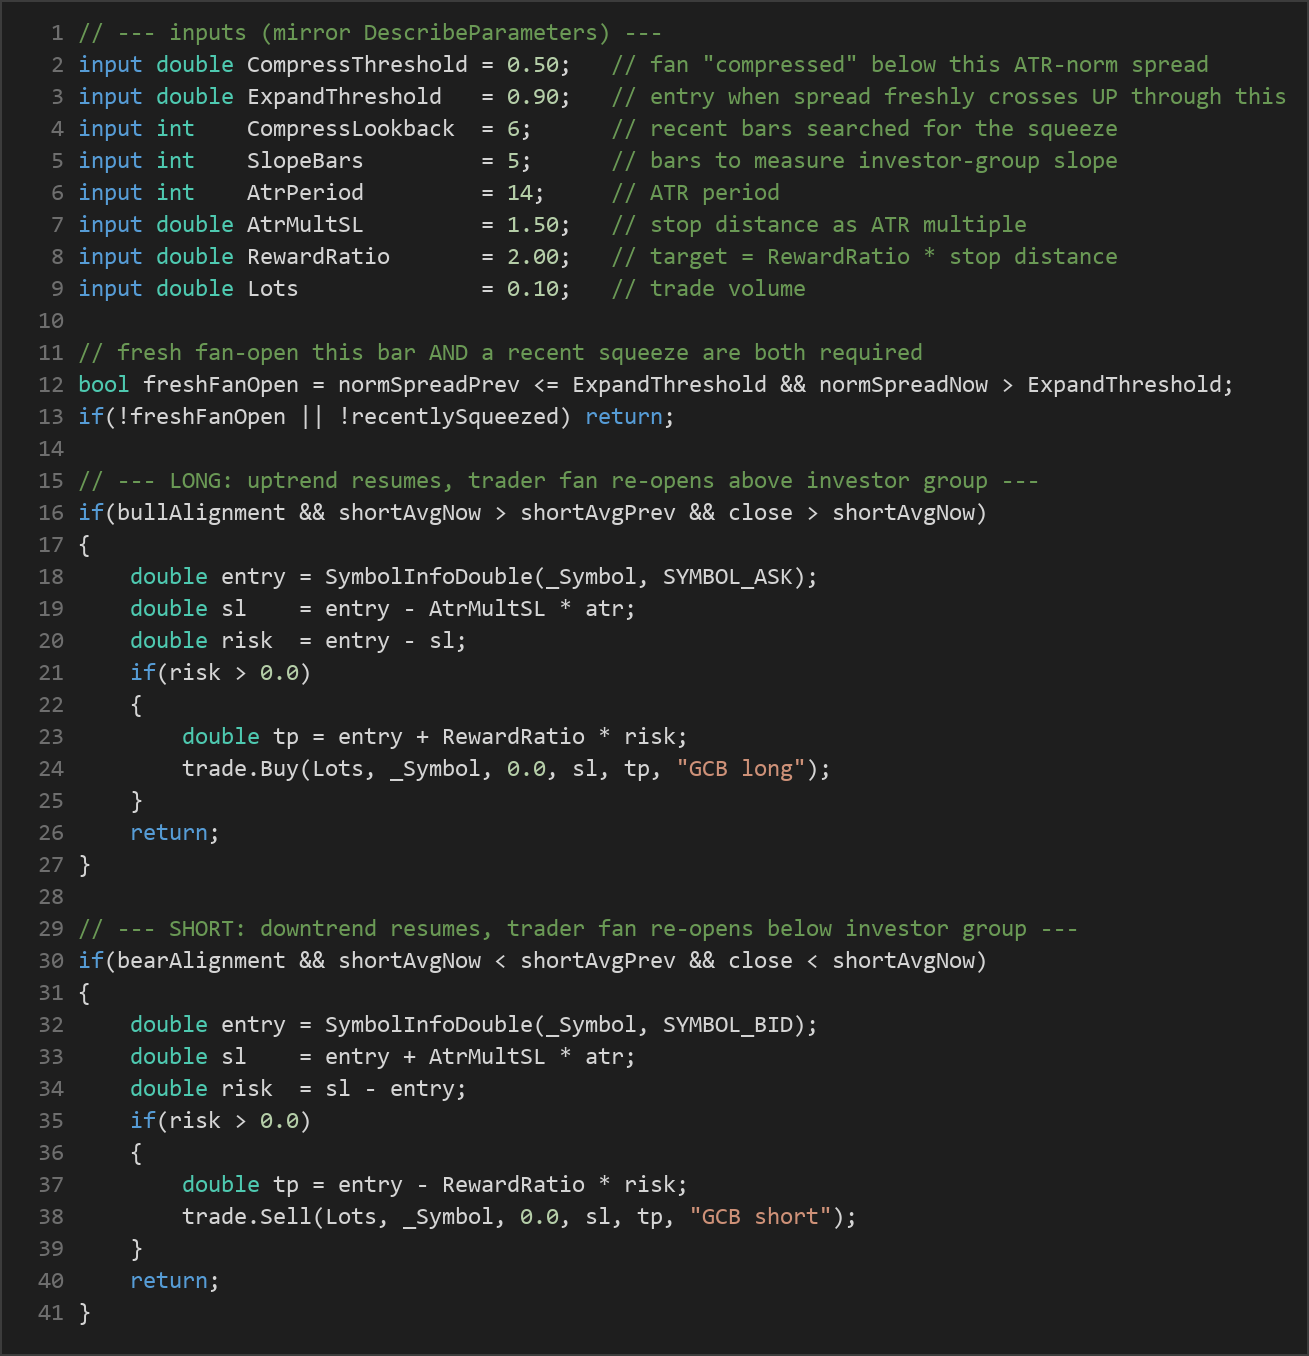
CompressThresholdat some point within the lastCompressLookbackbars (the squeeze). - The fan freshly opens on this bar — the normalised spread crosses up through
ExpandThreshold, having been at or below it on the prior bar. - The fast group's average ticks upward (it is higher than on the previous bar) and the bar closes above the fast group's average.
The strategy signals a short entry on the exact mirror image: the investor group is falling, the fast average sits below the slow average (bearish alignment), the trader fan squeezed and then fans open downward, the fast average ticks down, and price closes below the fast average.
Exit and trade management:
- Early exit on group cross: if an open position is running and the two groups cross against it (for a long, the fast average falls below the slow average; for a short, the fast average rises above it), the position is closed immediately because the alignment that justified the trade has flipped.
- Stop-loss: placed
AtrMultSL × ATRbeyond the entry price — below entry for longs, above entry for shorts. - Take-profit: set at
RewardRatiotimes the stop distance, giving a fixed, volatility-scaled reward-to-risk ratio. - One trade at a time: the strategy never stacks positions on the same magic number; a new signal is ignored while a position is open.
Strategy Parameters
| Parameter | Default | Min | Max | Description |
|---|---|---|---|---|
| CompressThreshold | 0.50 | 0.20 | 1.20 | The trader fan is considered "compressed" (squeezed) when its ATR-normalised spread drops below this value. |
| ExpandThreshold | 0.90 | 0.40 | 2.00 | An entry fires when the ATR-normalised spread freshly crosses up through this value (the fan re-opening). |
| CompressLookback | 6 | 2 | 15 | How many recent bars back the strategy searches for the preceding compression (the squeeze). |
| SlopeBars | 5 | 2 | 20 | Number of bars used to measure the investor (slow) group's slope and trend direction. |
| AtrPeriod | 14 | 5 | 40 | The lookback period for the ATR volatility calculation. |
| AtrMultSL | 1.50 | 0.50 | 5.00 | Stop-loss distance expressed as a multiple of ATR. |
| RewardRatio | 2.00 | 1.00 | 5.00 | Take-profit distance as a multiple of the stop distance (reward-to-risk ratio). |
| Lots | 0.10 | 0.01 | 1.00 | Trade volume in lots. |
| Magic | 6041 | 0 | 9,999,999 | Unique identifier so the EA only manages its own positions. |
Recommended Chart Settings
This strategy was designed with trending instruments in mind — a trending FX major or a metal such as EURUSD or XAUUSD — studied on the H1 or H4 timeframe. Those conditions give the trader fan room to compress and expand meaningfully around a persistent investor-group trend.
That said, the logic is deliberately timeframe-agnostic: because the fan spread is normalised by ATR, the compression and expansion thresholds adapt to whatever symbol and timeframe the EA is attached to. You are encouraged to backtest across several instruments and timeframes to understand how the behaviour changes. Results will vary considerably across different market conditions, and a setting that looks reasonable on one instrument may behave very differently on another.
How to Install on MetaTrader 5
- Download the .ex5 file from the link below
- Copy it to your MT5
MQL5\Expertsfolder - Restart MetaTrader 5 or refresh the Navigator panel
- Drag the EA onto a chart matching the recommended symbol and timeframe
- Configure the input parameters and enable Algo Trading
What to Consider Before Using This EA
Strengths of this approach. The Guppy Compression Breakout is built around continuation rather than prediction. By requiring a prior squeeze, a fresh fan-open, bullish or bearish group alignment, and a confirming close, it stacks several conditions that must agree before a trade is taken. This filtering tends to keep the strategy out of choppy, directionless markets where the two groups are tangled together. The ATR normalisation is also a genuine strength: it lets the same thresholds behave consistently across symbols and timeframes instead of needing constant manual retuning.
Known limitations. Like all moving-average systems, the GMMA is inherently lagging — the EMAs are computed from prices that have already occurred, so signals arrive after a move is underway. In sideways or range-bound markets the trader fan can compress and expand repeatedly without any durable trend, which may produce entries that are quickly stopped out or closed by the group-cross exit. The strategy also takes only one position at a time per magic number, so it will not pyramid into a strong trend, and its fixed reward-to-risk target means it can give back open profit if a move stalls before reaching the take-profit level.
Where it may underperform. Expect weaker behaviour during low-volatility consolidation, around major news spikes that whip the EMAs, and in markets that grind sideways for extended periods. The strategy is designed for trends; when trends are absent, the "squeeze then fan" pattern loses its meaning. Studying when it struggles is as valuable, educationally, as studying when it signals cleanly.
Risk Management Tips
Sound risk management matters far more than any single indicator setting. Consider these general principles as you study this strategy:
- Position sizing: Keep your trade size proportionate to your account. Many educational sources suggest risking no more than 1–2% of account equity on any single trade.
- Use a demo account first: Test the EA thoroughly on a demo or backtest environment before ever considering live capital, so you understand its behaviour without financial pressure.
- Understand drawdown: Every strategy experiences losing streaks. Review the maximum drawdown in your testing and ask yourself whether you could tolerate that decline emotionally and financially.
- Respect the stop-loss: The ATR-based stop exists to define your risk in advance. Disabling or widening it after the fact undermines the entire risk framework.
- Diversify your study: Avoid concentrating all your analysis on a single instrument or timeframe; observing the strategy across several conditions gives a more honest picture.
Risk Warning
Trading foreign exchange, CFDs, and other leveraged financial instruments involves substantial risk of loss and is not suitable for all investors. The strategies and tools discussed on this page are provided for educational purposes only and do not constitute financial advice, investment recommendations, or solicitation to trade. Always consult a qualified financial adviser before making trading decisions. Past backtest performance is not indicative of future results.
Downloads
- Expert Advisor: GuppyCompressionBreakout.ex5 (30 downloads)
- Source Code: GuppyCompressionBreakout.mq5 (27 downloads)
- Documentation: GuppyCompressionBreakout.pdf (35 downloads)