Disclaimer: This article is for educational and informational purposes only. It does not constitute financial or investment advice. Trading forex and CFDs carries significant risk of loss. Past performance of any strategy — including backtests — does not guarantee future results. Never trade with money you cannot afford to lose.
What Is This Strategy?
The Gaussian Channel Breakout is a trend-following breakout strategy built around an Ehlers multi-pole Gaussian filter — a smoothing technique that shapes a moving average toward the bell-curve (central-limit) response instead of the laggy tail of an ordinary exponential moving average (EMA). Where a single-pole EMA lags and lets high-frequency market "chop" leak through, cascading several identical filter stages produces a far sharper cutoff with less delay for the same amount of smoothness. The result is a clean, breathing price channel that a trader can use to separate genuine directional moves from noise.
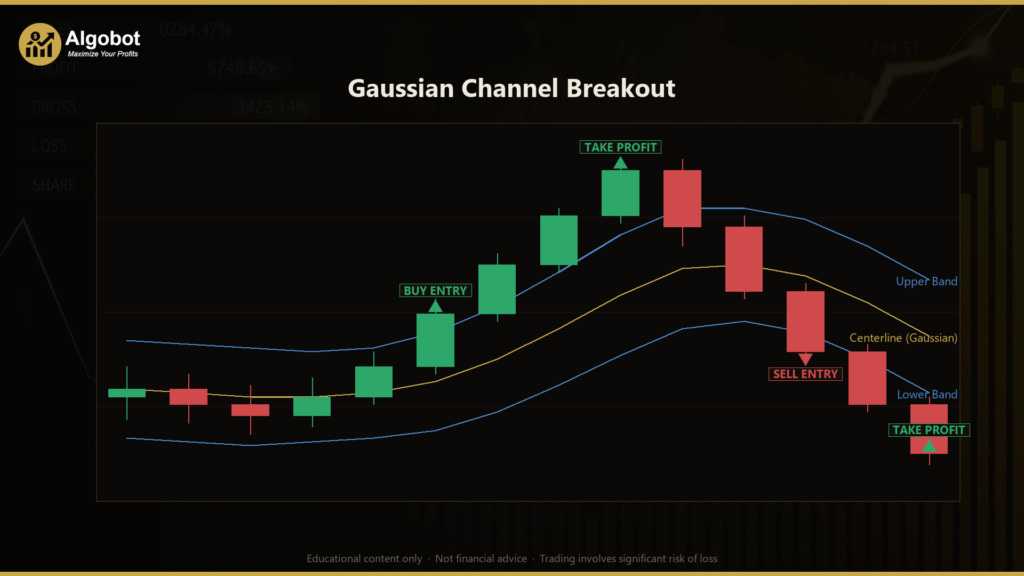
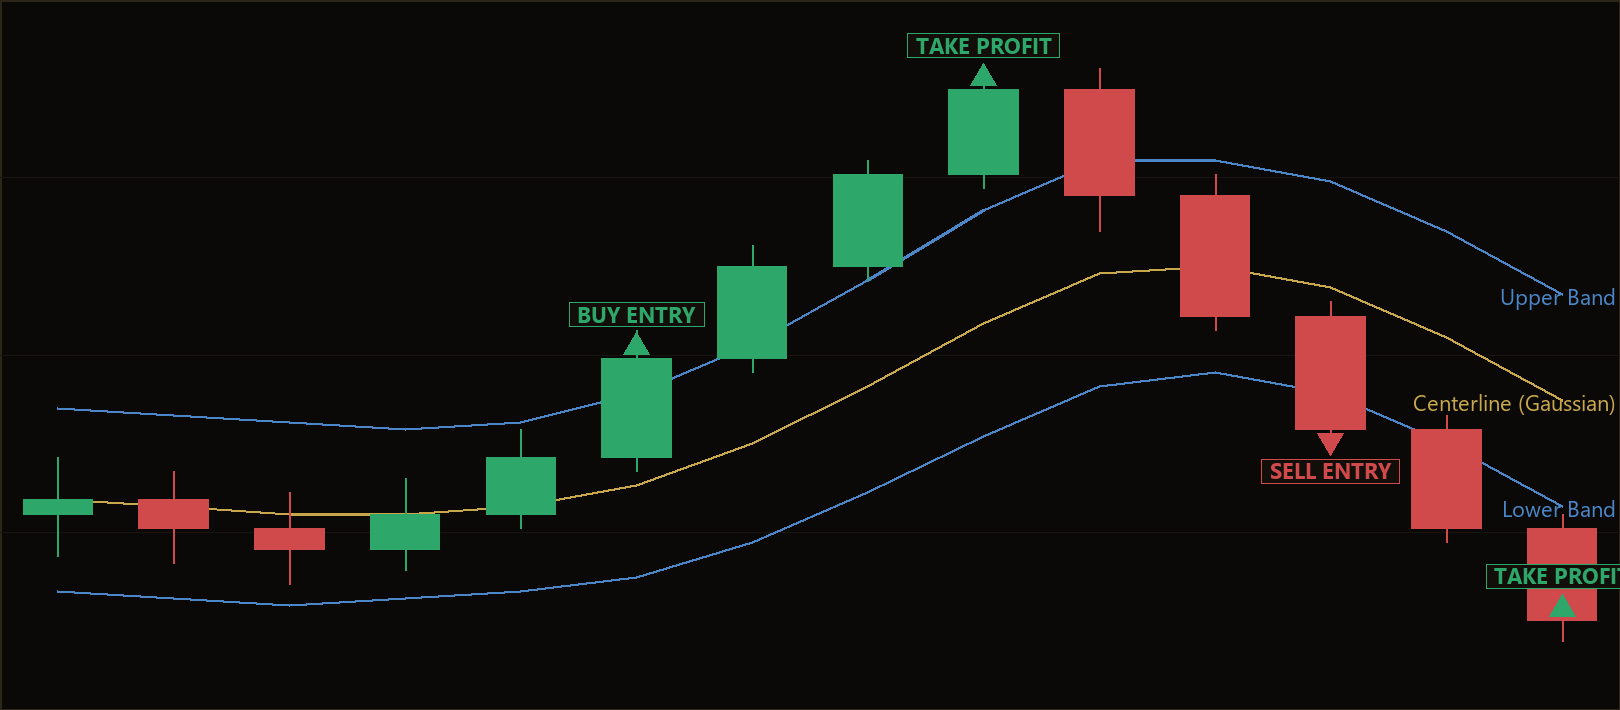
The strategy is designed for trending market conditions. It plots a smooth centerline (the Gaussian filter applied to closing prices) and wraps a volatility-based envelope around it (the same filter applied to True Range, the measure of a bar's full high-to-low travel). When price decisively closes outside that envelope and the centerline is already tilting in the same direction, the strategy interprets this as a breakout backed by an established drift rather than a random poke that fades back inside a flat range.
As a learning tool, the Gaussian Channel Breakout is well suited to traders who want to study how digital-signal-processing filters can be applied to price data, and how combining a slope filter with a band cross reduces false signals. It is not a shortcut to results — it is a transparent, rules-based framework for understanding breakout logic, volatility-scaled channels, and stop-and-reverse position management. Treat it as a study of how a systematic breakout model is constructed, not as a claim about outcomes.
How It Works
The strategy evaluates its rules once per closed bar on the chart's primary timeframe. Working on closed bars (rather than the still-forming current bar) avoids acting on prices that can still change before the bar finishes. Here is what happens on each completed bar:
- The centerline is calculated. The Gaussian filter is applied to closing prices to produce a smooth centerline. The
Lengthparameter sets the cutoff period (how smooth and slow it is), andPolessets how many filter stages are cascaded (more poles means a sharper, more Gaussian-like response). - The channel width is calculated. The same Gaussian filter is applied to True Range, then multiplied by
BandMult. This gives an upper band (centerline + width) and a lower band (centerline − width) that expand and contract with volatility. - The centerline slope is checked. The strategy compares the centerline now versus one bar ago to determine whether it is rising or falling.
Entry conditions are where the slope filter and the band cross work together:
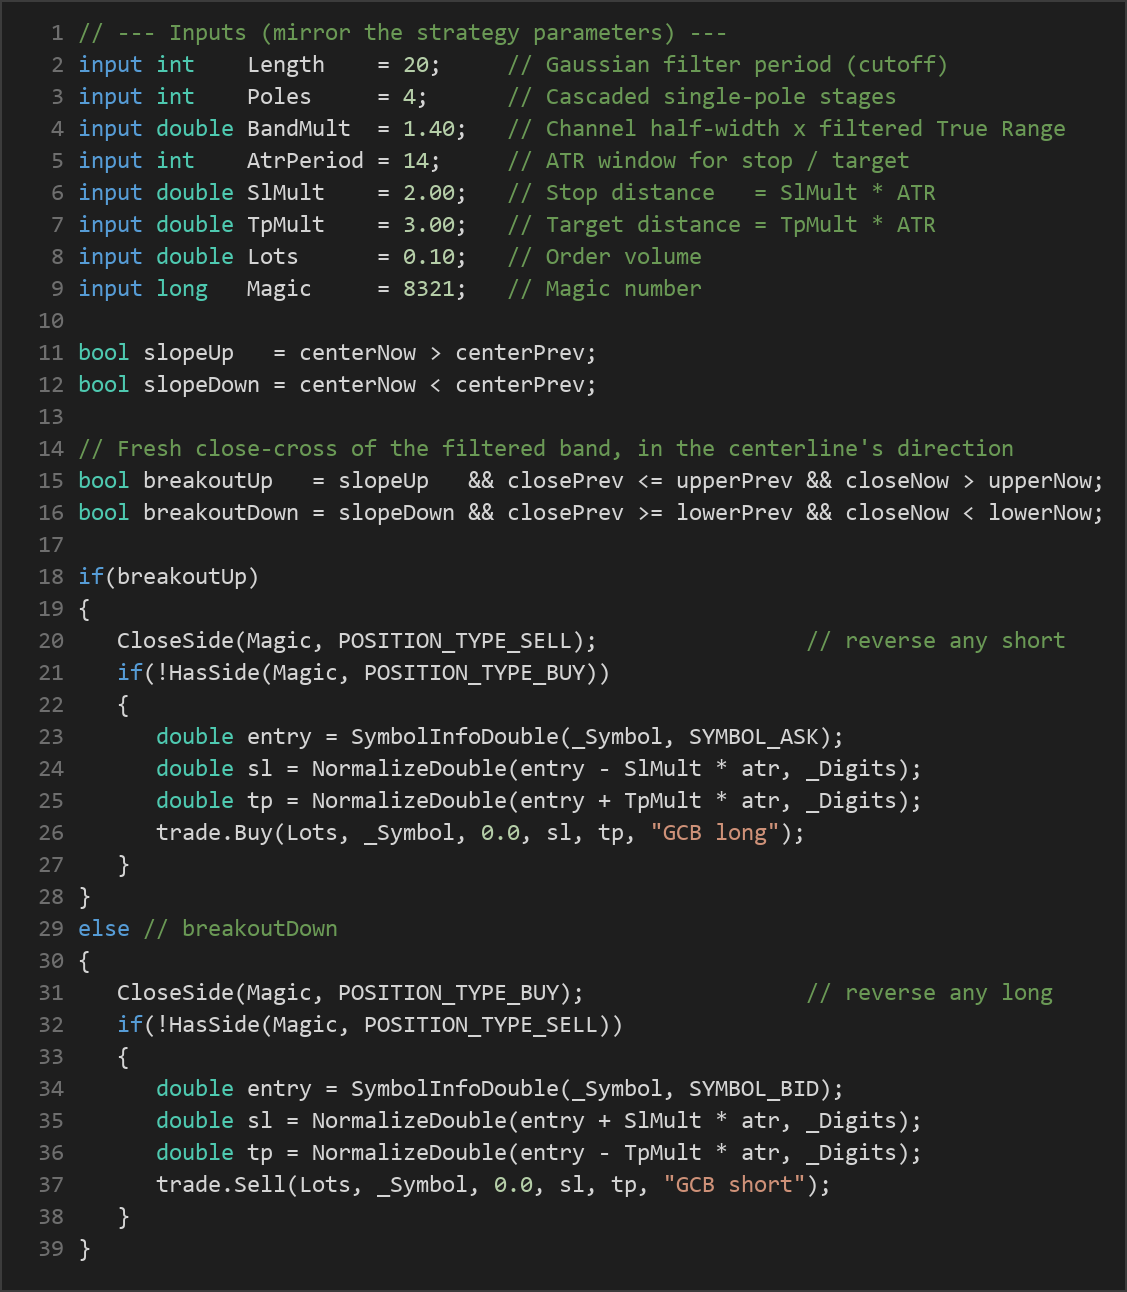
- Long entry — the strategy signals a long when the centerline is rising AND the close crosses from at or below the upper band to above it (a fresh upside breakout in the direction the trend is already tilting).
- Short entry — the strategy signals a short when the centerline is falling AND the close crosses from at or above the lower band to below it (a fresh downside breakout aligned with the drift).
Requiring both a same-side slope and a fresh close beyond the band is the core idea: it historically filters out the mean-reverting pokes that fade inside a flat channel and keeps only breakouts backed by an established direction.
Exit and reversal logic is stop-and-reverse:
- The system holds one position at a time. When an opposite breakout fires, it closes the current trade and opens a new one in the new direction.
- Stop-loss: placed at
SlMult × ATRaway from the entry price (ATR is the Average True Range, a standard volatility gauge). For a long, the stop sits below entry; for a short, above. - Take-profit: placed at
TpMult × ATRaway from entry — above for longs, below for shorts.
Because both the stop and target are expressed as ATR multiples, the risk distance automatically scales with the volatility of whatever symbol and timeframe you run it on, rather than using a fixed number of pips.
Strategy Parameters
| Parameter | Default | Min | Max | Description |
|---|---|---|---|---|
| Length | 20 | 8 | 80 | Gaussian filter period (cutoff). Larger values make the centerline smoother and slower to turn. |
| Poles | 4 | 1 | 6 | Number of cascaded single-pole filter stages. More poles produce a sharper, more Gaussian-like cutoff. |
| BandMult | 1.40 | 0.50 | 3.50 | Channel half-width as a multiple of the Gaussian-filtered True Range. Higher values widen the bands. |
| AtrPeriod | 14 | 5 | 40 | Lookback window for the ATR used in stop and target distances. |
| SlMult | 2.00 | 0.50 | 5.00 | Protective stop distance, expressed as a multiple of ATR. |
| TpMult | 3.00 | 0.50 | 8.00 | Take-profit distance, expressed as a multiple of ATR. |
| Lots | 0.10 | 0.01 | 1.00 | Order volume (position size) in lots. |
| Magic | 8321 | 0 | 9,999,999 | Magic number used to identify and manage this EA's own trades. |
Recommended Chart Settings
The Gaussian Channel Breakout runs on a single timeframe — whatever timeframe you attach it to — and was designed with trending instruments in mind. It is well suited to trending FX majors, metals, and index CFDs on the M15 to H4 timeframes, where directional moves tend to persist long enough for a filtered channel to add value.
The default Length of 20 with 4 poles produces a moderately smooth channel appropriate for these intraday-to-swing horizons. As always, market behavior differs across symbols, sessions, and volatility regimes, so results will vary across different market conditions. Test any settings on your specific instrument and timeframe before drawing conclusions, and re-evaluate periodically as conditions change.
How to Install on MetaTrader 5
- Download the
.ex5file from the link below. - Copy it to your MT5
MQL5\Expertsfolder. - Restart MetaTrader 5 or refresh the Navigator panel.
- Drag the EA onto a chart matching the recommended symbol and timeframe.
- Configure the input parameters and enable Algo Trading.
What to Consider Before Using This EA
Strengths of this approach. The Gaussian filter is a genuine improvement over a plain EMA for channel construction: cascading poles gives a sharper separation between signal and noise with less lag, which can mean fewer whipsaw signals in choppy conditions. Pairing the band cross with a centerline-slope filter adds a second layer of confirmation, and the ATR-scaled stops and targets mean the strategy adapts its risk distance to the live volatility of each market. The stop-and-reverse design also keeps the logic simple — there is always at most one position, and direction changes are explicit.
Known limitations. Like all breakout and trend-following methods, this strategy is vulnerable to range-bound, sideways markets, where price repeatedly closes just beyond a band only to reverse. In those conditions the slope filter helps but cannot eliminate false breakouts, and a sequence of stop-outs (a drawdown) is possible. Filters that smooth heavily also introduce some lag, so entries may occur after a meaningful portion of a move has already happened. The stop-and-reverse mechanic can be costly during "chop" because it flips the position on each opposite signal, and a fixed take-profit multiple may cut winners short during unusually strong trends.
Where it may underperform. Expect weaker behavior around major news spikes, during low-liquidity sessions, and in tightly ranging markets. No single parameter set is optimal across all instruments, so treat the defaults as a starting point for study rather than a finished configuration. The goal is to understand the strategy's behavior, not to assume any particular result.
Risk Management Tips
Risk management matters more than any single entry rule. Consider these general principles as part of your education:
- Risk a small, fixed fraction per trade. Many educational sources suggest never risking more than 1–2% of account equity on a single position. Size your
Lotsso that the distance to your stop-loss represents that fraction, not a round number chosen at random. - Understand drawdown. Every strategy experiences losing streaks. Study the maximum peak-to-trough decline you would have to tolerate before you commit real capital, and ask whether you could sit through it without abandoning the plan.
- Practice on a demo account first. Run the EA on a demo or simulated account to observe how it behaves across different sessions and volatility regimes before considering any live use.
- Account for real trading costs. Spreads, commissions, and slippage all erode results and are often understated in idealized tests. Factor them in.
- Don't over-optimize. Tuning parameters until a backtest looks perfect ("curve fitting") usually produces a model that fails on new data. Prefer robust settings that work reasonably across several instruments over fragile ones that only shine on one.
Risk Warning
Trading foreign exchange, CFDs, and other leveraged financial instruments involves substantial risk of loss and is not suitable for all investors. The strategies and tools discussed on this page are provided for educational purposes only and do not constitute financial advice, investment recommendations, or solicitation to trade. Always consult a qualified financial adviser before making trading decisions. Past backtest performance is not indicative of future results.
Downloads
- Expert Advisor: GaussianChannelBreakout.ex5 (56 downloads)
- Source Code: GaussianChannelBreakout.mq5 (66 downloads)
- Documentation: GaussianChannelBreakout.pdf (69 downloads)