Disclaimer: This article is for educational and informational purposes only. It does not constitute financial or investment advice. Trading forex and CFDs carries significant risk of loss. Past performance of any strategy — including backtests — does not guarantee future results. Never trade with money you cannot afford to lose.
What Is This Strategy?
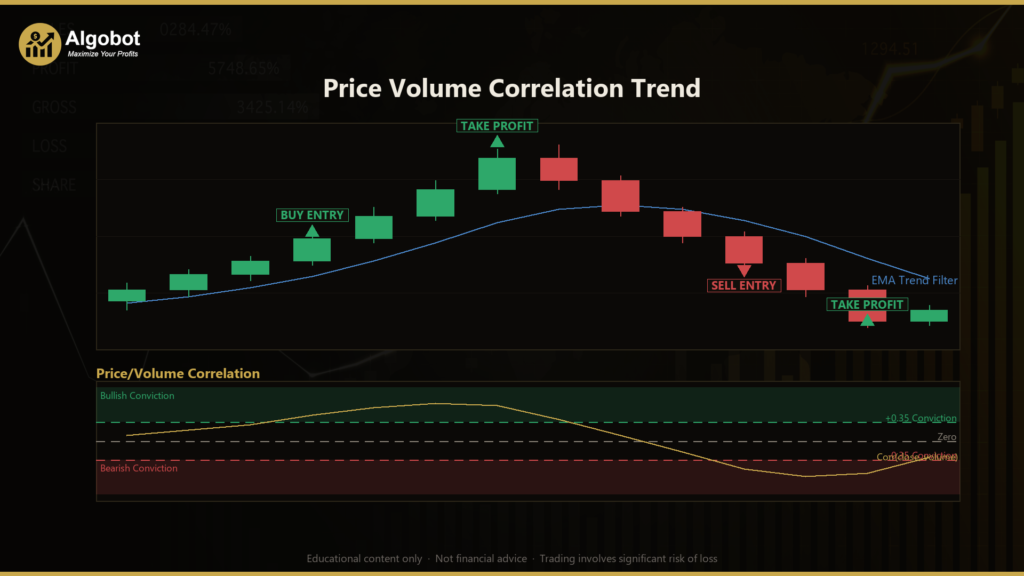
The Price Volume Correlation Trend strategy is a volume-confirmed trend-following system whose core engine is the rolling Pearson correlation between closing price and tick volume. Pearson correlation is a statistical measure, ranging from −1 to +1, that describes how tightly two series move together. Here it is applied to a moving window of recent candles to answer one simple question: as price has been moving, has trading participation been expanding in the same direction? When it has, the strategy treats that co-movement as a sign of genuine conviction behind a trend.
The idea rests on the old market adage that "effort accompanies result." In a healthy uptrend, more participants join as the move develops, so rising prices are accompanied by rising volume and the correlation turns positive. In a healthy downtrend, falling prices paired with rising volume push the correlation negative. A rally that unfolds on shrinking or indifferent volume produces a weak or wrong-signed correlation, and the strategy deliberately steps aside. This approach is intentionally different from accumulation-style volume tools such as OBV, CMF, or MFI, which weight or accumulate volume, and different from price-versus-time trend gauges, which ignore volume altogether.
As a learning tool, this strategy suits traders who want to understand how volume confirmation can be measured directly rather than inferred. It is best viewed as a study in combining a directional filter with a statistical timing signal, and it is designed for trending market conditions rather than flat, rangebound chop. It is not a shortcut to results — it is a framework for studying how price and participation interact.
How It Works
The strategy evaluates one completed candle at a time and only acts on the close of a new bar, which keeps signals stable and avoids reacting to a still-forming candle. It combines a trend-direction filter, a volume-conviction timing trigger, and an ATR-based risk frame.
- Trend filter (direction): An Exponential Moving Average (EMA) — a moving average that weights recent prices more heavily — defines the prevailing trend. The strategy signals an up-trend only when the last close is above the EMA and the EMA is sloping upward over a short internal lookback (3 bars). A down-trend requires the close below a downward-sloping EMA. This ensures trades align with both price position and momentum.
- Conviction meter (the primary signal): The signed Pearson correlation between close and tick volume is calculated over the most recent
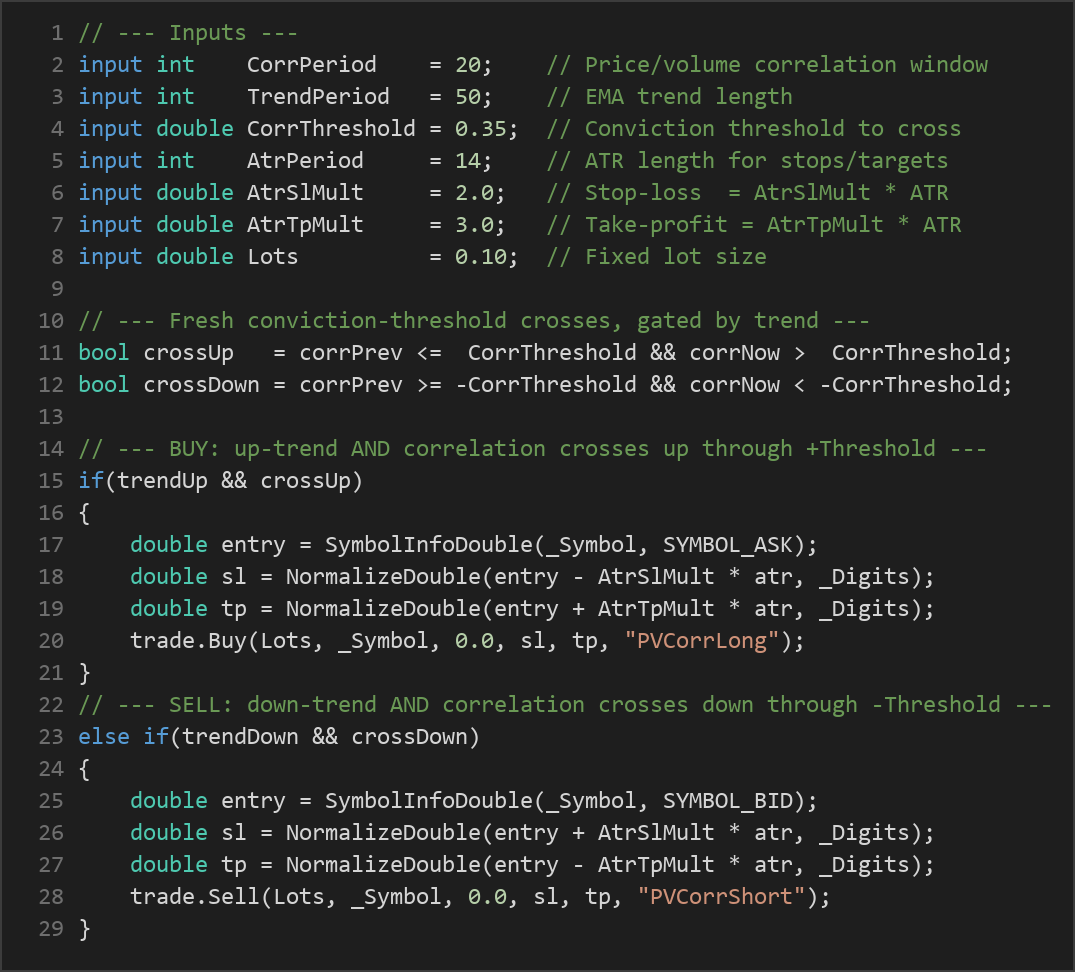
CorrPeriodbars, and again for the prior bar, so the strategy can detect a fresh cross rather than a stale reading. - Long entry: The strategy signals a long when an up-trend is in force and the correlation crosses up through the positive
CorrThreshold. This marks the moment volume confirmation ignites, rather than joining a move already saturated. - Short entry: The strategy signals a short when a down-trend is in force and the correlation crosses down through the negative
CorrThreshold. - Stop-loss logic: Every trade is framed by an ATR-based stop. ATR (Average True Range) measures recent volatility. The stop is placed
AtrSlMult × ATRbelow the entry for longs, or above the entry for shorts, so risk automatically adapts to current market volatility. - Take-profit logic: The target is set
AtrTpMult × ATRin the trade's favor, giving a volatility-scaled reward objective. - Conviction-loss exit: Beyond the fixed stop and target, an open position is closed early if the correlation loses the sign that justified it — a long is exited when the correlation falls to zero or below, and a short is exited when it rises to zero or above. This trims trades whose volume backing has evaporated before the stop is reached.
- Position management: The strategy holds only one position per magic number at a time and uses fixed-lot sizing, keeping behavior simple and repeatable.

Strategy Parameters
| Parameter | Default | Min | Max | Description |
|---|---|---|---|---|
| CorrPeriod | 20 | 8 | 60 | Window length (in bars) for the price/volume Pearson correlation — the conviction meter. |
| TrendPeriod | 50 | 20 | 200 | EMA length that defines the prevailing trend direction. |
| CorrThreshold | 0.35 | 0.10 | 0.80 | Conviction threshold the signed correlation must freshly cross to trigger an entry. |
| AtrPeriod | 14 | 7 | 30 | ATR length used to calculate stop-loss and take-profit distances. |
| AtrSlMult | 2.0 | 1.0 | 4.0 | Stop-loss distance as a multiple of ATR from the entry price. |
| AtrTpMult | 3.0 | 1.0 | 6.0 | Take-profit distance as a multiple of ATR from the entry price. |
| Lots | 0.10 | 0.01 | 1.0 | Fixed trade size in lots. |
The parameter set is intentionally small and broadly ranged to reduce the temptation of curve-fitting — tuning values so precisely to past data that they fail on new data.
Recommended Chart Settings
This strategy is timeframe-agnostic by design: every calculation uses the chart's currently selected period, so it runs on whatever timeframe you attach it to. A practical starting point for study is a liquid major forex pair such as EUR/USD on the H1 (1-hour) timeframe, where tick-volume data is dense enough to make the price/volume correlation meaningful and trends persist long enough for the EMA filter to work. Higher timeframes tend to produce fewer, cleaner signals, while lower timeframes generate more signals but more noise.
Because tick volume is a proxy for the number of price updates rather than true traded contracts, its character differs across brokers and instruments. Results will vary across different market conditions, symbols, and brokers, so any timeframe you choose should be studied on your own data before drawing conclusions.
How to Install on MetaTrader 5
- Download the .ex5 file from the link below
- Copy it to your MT5
MQL5\Expertsfolder - Restart MetaTrader 5 or refresh the Navigator panel
- Drag the EA onto a chart matching the recommended symbol and timeframe
- Configure the input parameters and enable Algo Trading
What to Consider Before Using This EA
The main strength of the Price Volume Correlation Trend approach is that it seeks confirmation rather than prediction. By requiring both a directional EMA filter and a fresh volume-conviction cross, it avoids entering purely on price momentum that lacks participation behind it. The conviction-loss exit adds a layer of adaptive risk control that can release a position before the stop when the volume story changes, which may indicate the move is fading.
There are, however, real limitations to understand. Tick volume is not true exchange volume; in decentralized forex markets it counts price changes, which is only a proxy for genuine activity. Correlation is also a co-movement measure, not a causation measure — a high reading tells you price and volume moved together historically, not that the trend will continue. Like all trend-following systems, this strategy tends to underperform in flat, choppy, or rangebound conditions, where the EMA slope flip-flops and correlation crosses produce false starts. Sharp news-driven spikes can also distort the correlation window temporarily.
You should treat this EA as an analytical instrument for studying volume-confirmed trend logic, not as a finished trading solution. Its behavior depends heavily on the symbol, timeframe, and broker feed you use, and it will experience losing streaks like any strategy. Thorough forward-testing on a demo account is essential before drawing any conclusions.
Risk Management Tips
- Position sizing: Keep trade size proportional to your account. Many educators suggest risking no more than 1–2% of account equity on any single trade, so a string of losses cannot do outsized damage.
- Use a demo account first: Run the strategy on a demo or paper account long enough to see how it behaves across trending and ranging conditions before considering any live capital.
- Understand drawdown: Every strategy endures periods of consecutive losses. Study the maximum drawdown — the largest peak-to-trough equity decline — so you know what to expect emotionally and financially.
- Respect the stops: The ATR-based stop-loss is central to this design. Disabling or widening it removes the risk frame the strategy was built around.
- Diversify and stay realistic: Avoid concentrating all risk in one instrument or one strategy, and never trade with funds you cannot afford to lose.
Risk Warning
Trading foreign exchange, CFDs, and other leveraged financial instruments involves substantial risk of loss and is not suitable for all investors. The strategies and tools discussed on this page are provided for educational purposes only and do not constitute financial advice, investment recommendations, or solicitation to trade. Always consult a qualified financial adviser before making trading decisions. Past backtest performance is not indicative of future results.
Downloads
- Expert Advisor: PriceVolumeCorrelationTrend.ex5 (39 downloads)
- Source Code: PriceVolumeCorrelationTrend.mq5 (47 downloads)
- Documentation: PriceVolumeCorrelationTrend.pdf (49 downloads)