Disclaimer: This article is for educational and informational purposes only. It does not constitute financial or investment advice. Trading forex and CFDs carries significant risk of loss. Past performance of any strategy — including backtests — does not guarantee future results. Never trade with money you cannot afford to lose.
What Is This Strategy?
Regression Breakpoint Trend is a structural-break, trend-emergence expert advisor built around the Chow test — a classic econometric statistic that detects whether the linear behaviour of a data series has genuinely changed at a specific point in time. Instead of waiting for a moving-average crossover or a channel breakout to confirm a trend that is already well under way, this strategy applies statistical hypothesis testing to raw closing prices and tries to act at the change-point itself. In trading terms, it is a trend-following system with a mean-reversion sensibility about timing: it hunts for the exact bar where a flat or fading market structurally turns into a new directional move.
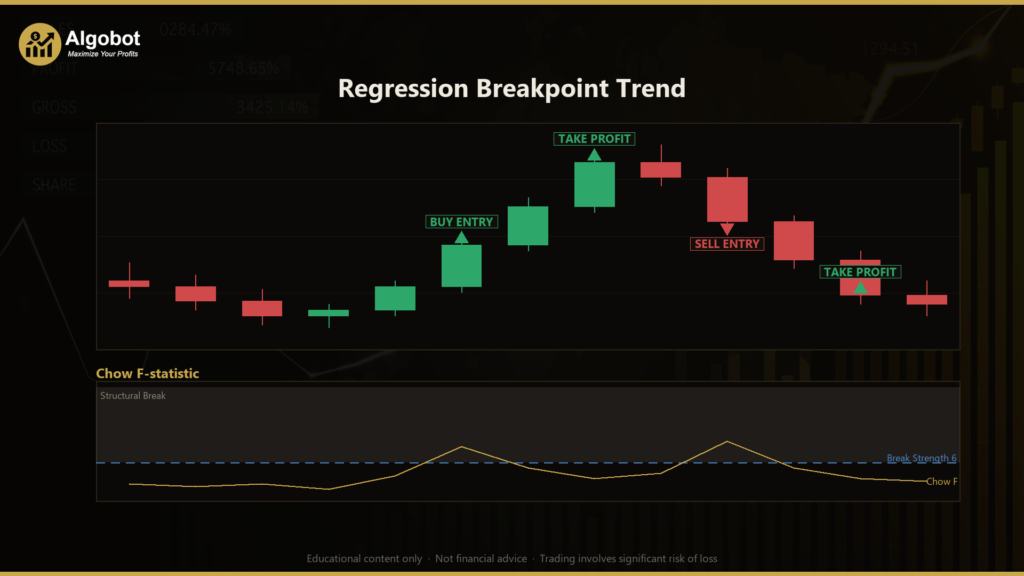
The core question the strategy asks on every closed bar is deceptively simple: "Has the straight-line trend in price just broken?" To answer it, the EA fits three least-squares regression lines over a rolling window of closes — one over the whole window, one over the older half, and one over the recent half. If a single line still describes the data well, the trend is intact and no signal fires. If the two-segment fit is dramatically tighter than the pooled fit, the Chow F-statistic spikes, flagging a statistically significant structural break. Direction is then read from the most recent segment's slope.
As a learning tool, Regression Breakpoint Trend is well suited to traders who want to understand how quantitative and econometric techniques translate into automated entries. It is designed for liquid instruments such as EURUSD, GBPUSD, or XAUUSD on higher timeframes like H1 or H4, where price structure is cleaner and regression fits are more meaningful. It is not a "set and forget" black box — it is a transparent, parameter-driven example of how statistical change-point detection can define trade timing.
How It Works
The strategy evaluates its logic once per newly closed bar, so intrabar noise never triggers a signal. Here is the full decision chain in plain English:
- Build the rolling window: The EA collects the most recent
Windowclosing prices (forced to an even number so it can be split cleanly in half). The older half becomes segment A; the recent half becomes segment B. - Fit three regression lines: Using ordinary least squares, the strategy computes a pooled line over the whole window (residual sum of squares
RSS_P), a line over segment A (RSS_A, slope A), and a line over segment B (RSS_B, slope B). Residual sum of squares simply measures how far the actual prices sit from the fitted line — smaller means a tighter fit. - Compute the Chow F-statistic: The strategy calculates
F = ((RSS_P − (RSS_A + RSS_B)) / k) / ((RSS_A + RSS_B) / (N − 2k)), wherek = 2parameters (intercept and slope). A large F means splitting the window into two lines explains the data far better than one line — i.e. the trend structurally broke. - Confirm the break is significant: The strategy signals a potential break only when
Fexceeds theBreakStrengththreshold. A steady, unchanging trend produces a low F (one line already fits it), so the system deliberately targets the emergence or reversal, not the middle of an established move. - Determine direction from the recent segment: For a long signal, the strategy requires
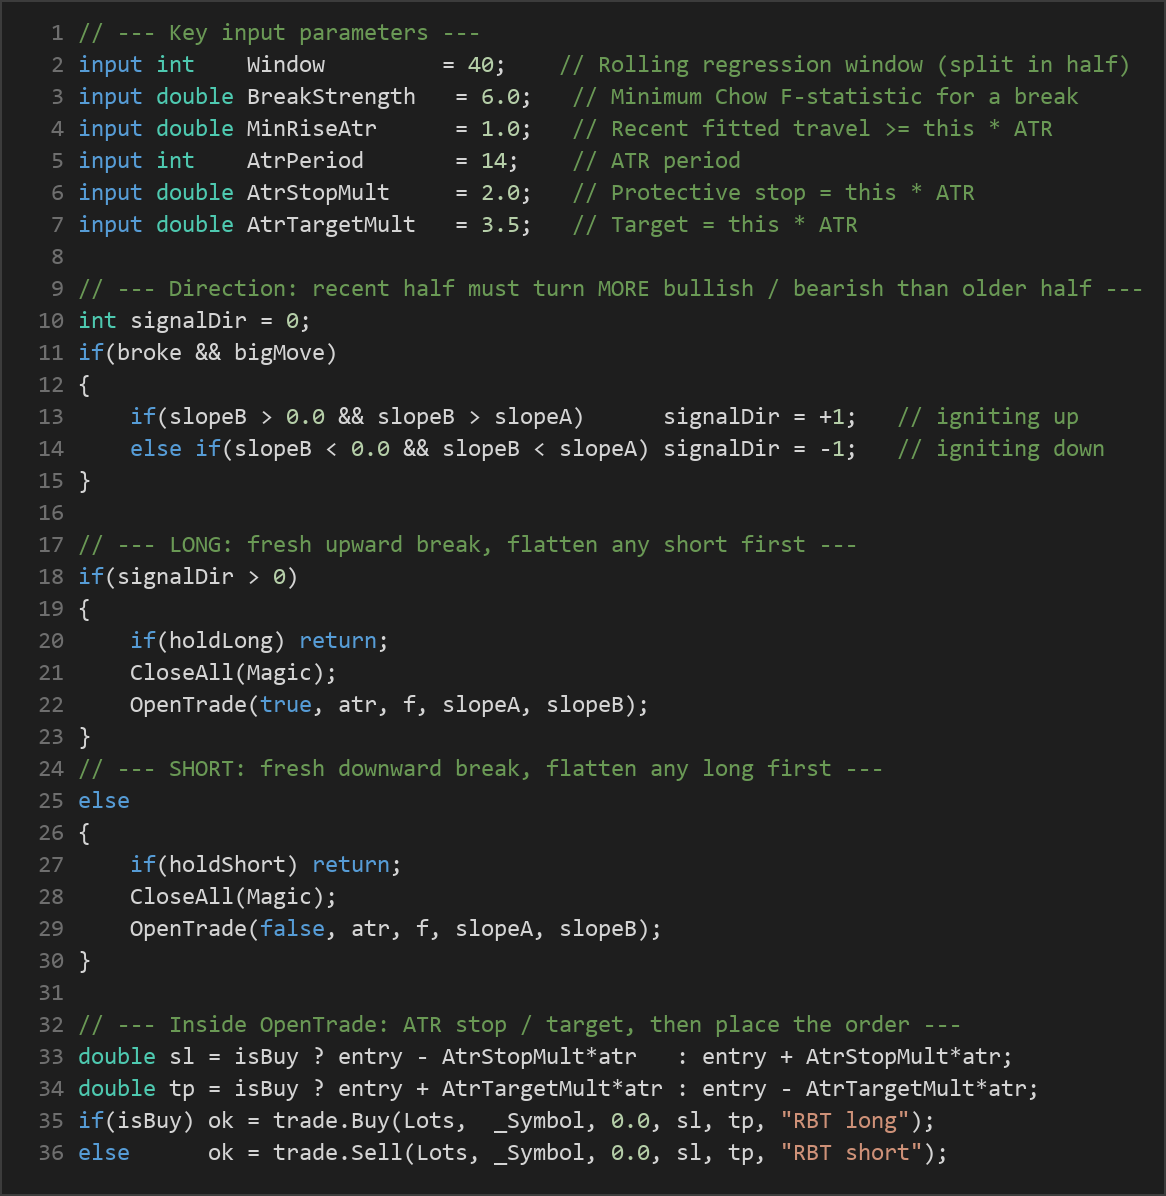
F > BreakStrength, slope B above zero, and slope B more bullish than slope A (the trend is igniting or turning up). For a short signal, it requires slope B below zero and more bearish than slope A. - Apply a magnitude gate: The
MinRiseAtrfilter demands that the recent segment's fitted price travel span at least a fraction of the current ATR. This skips statistically-significant-but-tiny wiggles that carry no tradable range. - De-bounce each emergence: A fresh break fires only once. The signal must reset to neutral before it can fire again in the same direction, preventing repeated entries on the same event.
- Spread filter: If the current spread exceeds
MaxSpreadPoints, the signal is skipped to keep fills realistic.
Entry and position management: When a valid long signal appears while no long is open, the EA flattens any existing short and opens a buy. A valid short signal does the mirror image — this is a stop-and-reverse design, so an opposite emergence closes the current trade and opens a new one in the fresh direction.
Stop-loss and take-profit: Risk is entirely ATR-based (ATR, the Average True Range, measures recent volatility). The protective stop is placed at AtrStopMult × ATR from entry, and the target at AtrTargetMult × ATR. Because both distances scale with volatility, the risk footprint adapts automatically as market conditions expand or contract.

Strategy Parameters
| Parameter | Default | Min | Max | Description |
|---|---|---|---|---|
| Window | 40 | 12 | 120 | Number of closes in the rolling regression window (forced even, split in half for the Chow test). Larger values react more slowly. |
| BreakStrength | 6.0 | 2.0 | 20.0 | Minimum Chow F-statistic required to accept a structural break. Higher values make signals stricter and rarer. |
| MinRiseAtr | 1.0 | 0.0 | 5.0 | The recent segment's fitted travel must span at least this multiple of ATR. Set to 0 to disable the magnitude gate. |
| AtrPeriod | 14 | 5 | 50 | Lookback period for the ATR used in the magnitude gate and in stop/target distances. |
| AtrStopMult | 2.0 | 0.5 | 6.0 | Protective stop distance as a multiple of the current ATR. |
| AtrTargetMult | 3.5 | 0.5 | 10.0 | Take-profit distance as a multiple of the current ATR. |
| MaxSpreadPoints | 30 | 0 | 200 | Skip a signal if the spread (in points) exceeds this value. Set to 0 to disable. |
| Lots | 0.10 | 0.01 | 1.0 | Fixed trade volume in lots. |
| Magic | 5307 | 0 | 9,999,999 | Unique identifier so the EA manages only its own positions. |
Recommended Chart Settings
Regression Breakpoint Trend was designed with liquid FX majors and metals in mind — EURUSD, GBPUSD, or XAUUSD — on the H1 or H4 timeframe, where regression fits are cleaner and structural breaks are more meaningful. That said, the logic is timeframe-agnostic: it reads whatever single (primary) timeframe is selected at backtest or run time. Because different instruments and sessions exhibit different volatility and trend behaviour, results will vary considerably across market conditions, and the default parameters are a starting point for study rather than a tuned configuration. Always test on your specific symbol and timeframe before drawing any conclusions.
How to Install on MetaTrader 5
- Download the .ex5 file from the link below
- Copy it to your MT5
MQL5\Expertsfolder - Restart MetaTrader 5 or refresh the Navigator panel
- Drag the EA onto a chart matching the recommended symbol and timeframe
- Configure the input parameters and enable Algo Trading
What to Consider Before Using This EA
The main strength of this approach is its timing discipline. By using the Chow test to detect change-points, the strategy tries to engage a trend at its emergence rather than chasing it after a lagging indicator finally confirms it. The insistence that the recent slope be more directional than the older slope, plus the ATR magnitude gate, filters out many low-quality, sideways signals. Its transparency also makes it an excellent educational example of how econometric hypothesis testing can be operationalised in a trading rule.
There are important limitations to understand. Regression assumes an approximately linear price path, which markets frequently violate — sharp gaps, spikes, and choppy ranges can produce misleading F-statistics. Because the system is built around emergence, it may fire early on false breaks that fail to develop into sustained trends, and the stop-and-reverse mechanism can generate a string of whipsaw losses during noisy, directionless periods. The strategy also holds no time-based or trailing exit beyond the ATR stop and target, so a move that stalls between the two levels can linger.
The strategy is most likely to underperform in low-volatility, range-bound markets where structural "breaks" are statistical artefacts rather than genuine trend changes, and around high-impact news where price behaviour is discontinuous. Historically, structural-break methods work best when a market actually transitions between regimes — and no filter can guarantee that a detected break will follow through.
Risk Management Tips
Sound risk management matters far more than any single entry signal. Consider these general principles as you study this EA:
- Risk a small, fixed fraction per trade. Many educational resources suggest never risking more than 1–2% of account equity on any single position. Size your
Lotsso that the ATR-based stop distance corresponds to that fraction, not the other way around. - Test on a demo account first. Run the strategy on a demo or in the Strategy Tester across different symbols, timeframes, and market regimes before considering any live use. This is how you learn how it behaves, not how it performs.
- Understand drawdown. Even a well-designed strategy will experience losing streaks. Know the maximum historical drawdown you are studying and ask whether you could psychologically and financially tolerate it.
- Account for costs. Spread, slippage, and swap all erode results. The built-in
MaxSpreadPointsfilter helps, but real-world execution will differ from idealised backtests. - Never over-leverage. Leverage magnifies both gains and losses. Keep position sizes conservative, especially while you are still evaluating a strategy's behaviour.
Risk Warning
Trading foreign exchange, CFDs, and other leveraged financial instruments involves substantial risk of loss and is not suitable for all investors. The strategies and tools discussed on this page are provided for educational purposes only and do not constitute financial advice, investment recommendations, or solicitation to trade. Always consult a qualified financial adviser before making trading decisions. Past backtest performance is not indicative of future results.
Downloads
- Expert Advisor: RegressionBreakpointTrend.ex5 (31 downloads)
- Source Code: RegressionBreakpointTrend.mq5 (25 downloads)
- Documentation: RegressionBreakpointTrend.pdf (34 downloads)