Disclaimer: This article is for educational and informational purposes only. It does not constitute financial or investment advice. Trading forex and CFDs carries significant risk of loss. Past performance of any strategy — including backtests — does not guarantee future results. Never trade with money you cannot afford to lose.
What Is This Strategy?
The Opposing Volume Dominance Pivot is a trend-resumption strategy built around a pocket-pivot volume-dominance signature, paired with an Exponential Moving Average (EMA) trend filter and an Average True Range (ATR) volatility model. An EMA is a moving average that weights recent prices more heavily, so it tracks the trend while smoothing noise. ATR measures how much price typically moves per bar, giving a volatility-based ruler for pullbacks and risk. The strategy is a with-trend system: it looks to re-enter an established trend after a shallow pullback, rather than to catch tops and bottoms.
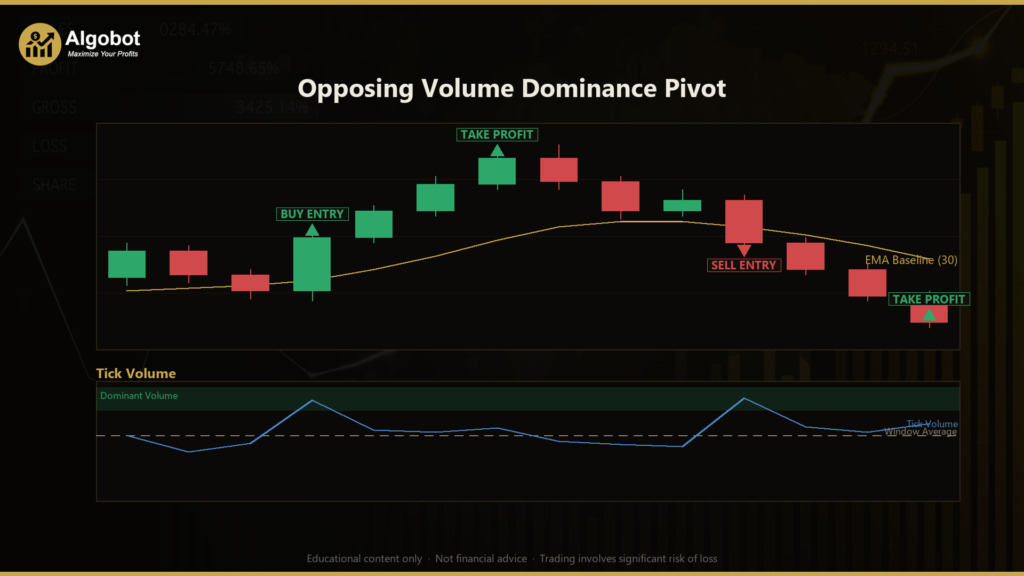
What makes this approach distinctive is how it reads volume. Most volume filters compare the current bar to an average volume, or accumulate a running total the way On-Balance Volume does. This strategy asks a sharper, more specific question: did the current with-trend bar's tick volume just overwhelm the single strongest opposing-colour bar of the recent lookback window? When a bullish bar prints more tick volume than the heaviest down bar of the last several bars, the strongest recent selling has — historically — been absorbed and beaten by demand in a single bar. That footprint is often described as accumulation. The mirror logic (a bearish bar beating the strongest up bar) is read as distribution.
As a learning tool, the Opposing Volume Dominance Pivot is well suited to traders who want to study how volume, trend, and volatility can be combined into a single, rules-based decision. It is designed for trending market conditions on liquid instruments, and it demonstrates concepts — relative volume dominance, pullback timing, and volatility-scaled risk — that appear across many professional systems. It is best treated as a framework for analysis and practice, not as a shortcut of any kind.
How It Works
The strategy evaluates its logic once per newly closed bar, using the just-closed bar as the "signal" bar. It only considers a new entry when there is no open position for its magic number and when the current spread is within the allowed limit.
The strategy signals a long entry when all of the following are true:
- Trend is up — the signal bar closes above the EMA, and the EMA is rising (its value now is greater than its value
TrendSlopeBarsbars ago). - Pullback to the baseline — the signal bar's low dipped back to within
PullbackAtrMult × ATRof the EMA, meaning price pulled toward the average rather than extending far away from it. - Bullish bar — the signal bar closed above its open.
- Volume dominance — the signal bar's tick volume exceeds the strongest down (opposing-colour) bar in the lookback window, and clears
VolFactor ×the window's average volume, so even a window with no opposing bars still requires a genuine volume thrust.
The strategy signals a short entry under the mirror-image conditions:
- The signal bar closes below a falling EMA.
- The signal bar's high reached back to within
PullbackAtrMult × ATRof the EMA. - The signal bar closed below its open (bearish).
- The signal bar's tick volume exceeds the strongest up bar in the lookback and clears the
VolFactor ×average-volume threshold.
Stop-loss and take-profit are fully volatility-scaled and set at entry:
- Stop-loss is placed
AtrStopMult × ATRaway from the entry price — below entry for longs, above entry for shorts. - Take-profit is placed at
RewardRiskRatio ×the stop distance, so a reward:risk of 1.8 targets 1.8 units of reward for every 1 unit of risk. - There is no separate exit rule — the ATR bracket (stop and target) manages every exit, and only one position per magic number is held at a time.
Because the pullback and risk logic are both anchored to ATR, the strategy automatically adapts its distances to the current volatility of the instrument and timeframe you run it on.
Strategy Parameters
| Parameter | Default | Min | Max | Description |
|---|---|---|---|---|
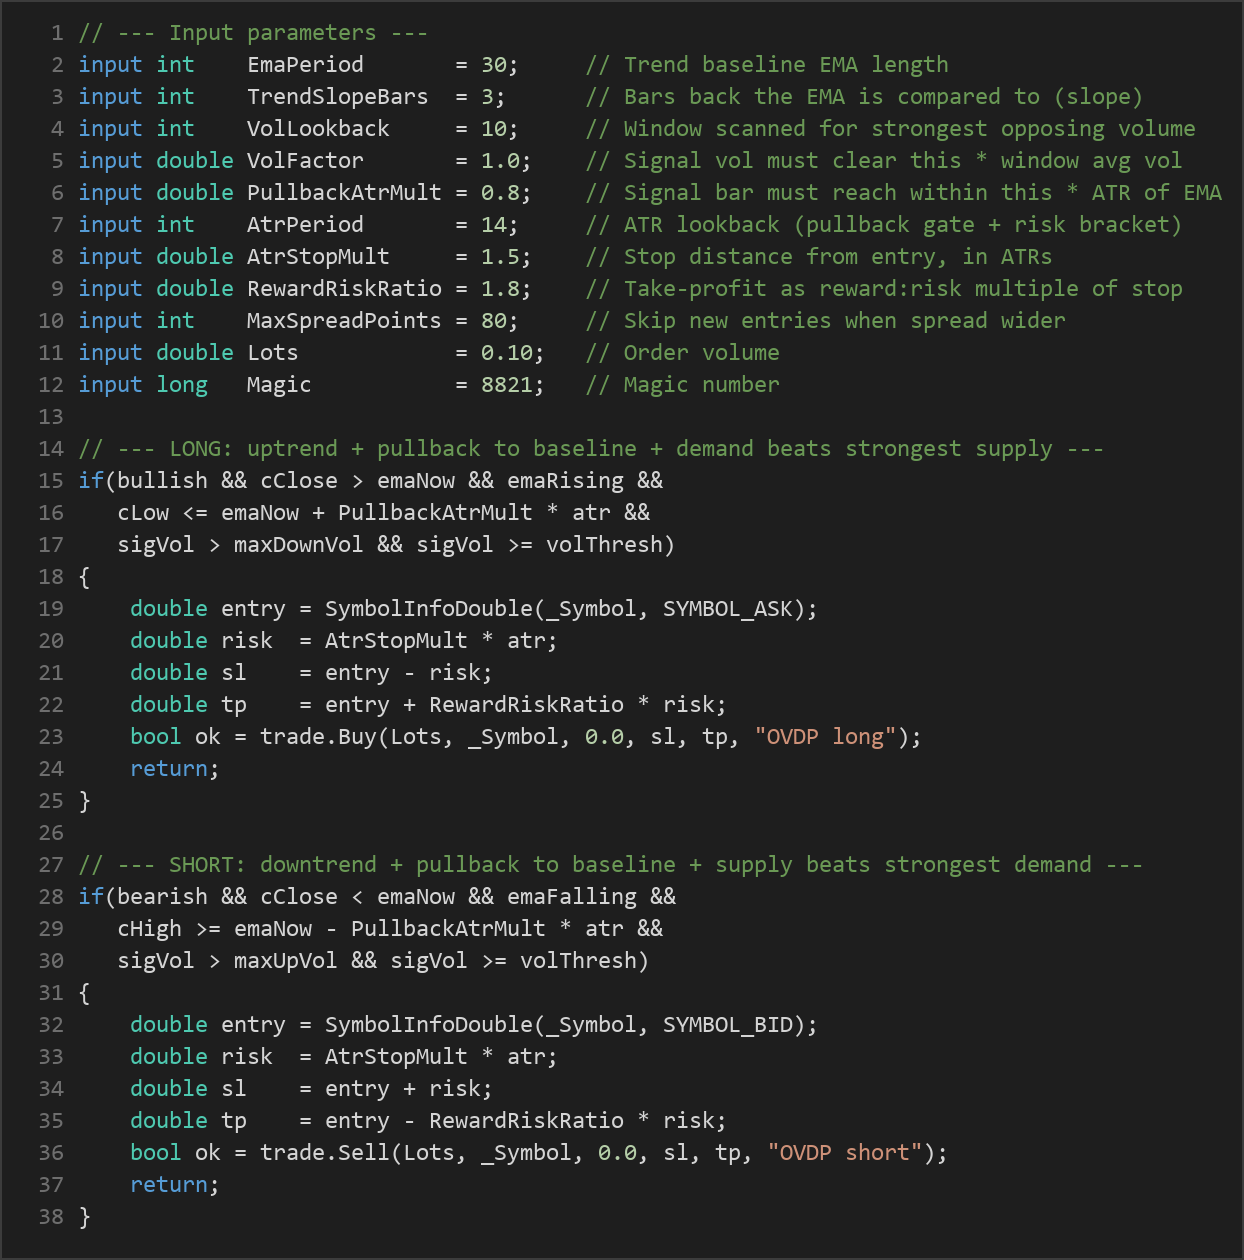
| EmaPeriod | 30 | 10 | 100 | Length of the EMA that defines the trend baseline. |
| TrendSlopeBars | 3 | 1 | 10 | How many bars back the EMA is compared to, to confirm slope direction. |
| VolLookback | 10 | 5 | 40 | Window (in bars) scanned for the strongest opposing-colour tick volume. |
| VolFactor | 1.0 | 0.5 | 3.0 | Signal volume must also clear this multiple of the window's average volume. |
| PullbackAtrMult | 0.8 | 0.1 | 3.0 | Pullback gate: the signal bar must reach within this × ATR of the EMA. |
| AtrPeriod | 14 | 5 | 30 | ATR lookback used for the pullback gate and the risk bracket. |
| AtrStopMult | 1.5 | 0.5 | 4.0 | Stop-loss distance from entry, measured in ATRs. |
| RewardRiskRatio | 1.8 | 1.0 | 5.0 | Take-profit as a reward:risk multiple of the stop distance. |
| MaxSpreadPoints | 80 | 5 | 300 | Skip new entries when the spread (in points) is wider than this. |
| Lots | 0.10 | 0.01 | 1.0 | Order volume in lots. |
| Magic | 8821 | 0 | 9,999,999 | Magic number used to identify this EA's positions. |
Recommended Chart Settings
The Opposing Volume Dominance Pivot was designed with liquid instruments in mind — forex majors, metals such as gold, and major stock indices — where tick volume is meaningful and spreads are typically tight. Its natural home is the M5 to H1 timeframes, where pullbacks and volume thrusts are frequent enough to generate signals without excessive noise.
That said, the strategy is not locked to any single timeframe: every price and bar reference uses the chart's primary timeframe, so it runs on whichever timeframe you attach it to. Because tick volume, spread behaviour, and volatility differ across instruments and sessions, results will vary considerably across different market conditions. Always test on the specific symbol and timeframe you intend to study before drawing any conclusions.
How to Install on MetaTrader 5
- Download the
.ex5file from the link below. - Copy it to your MT5
MQL5\Expertsfolder. - Restart MetaTrader 5 or refresh the Navigator panel.
- Drag the EA onto a chart matching the recommended symbol and timeframe.
- Configure the input parameters and enable Algo Trading.
What to Consider Before Using This EA
Strengths of the approach. The Opposing Volume Dominance Pivot combines three independent filters — trend, pullback location, and relative volume — so it only acts when several conditions align. The relative-volume test is more selective than a simple "above average volume" filter, because it demands that a single bar overpower the strongest opposing bar. Anchoring both the pullback gate and the risk bracket to ATR means the strategy adapts to changing volatility instead of using fixed pip distances. Its long and short logic is fully symmetric, and the fixed ATR stop and target impose disciplined, pre-defined risk on every trade.
Known limitations. Like all trend-resumption systems, it depends on trends actually continuing after a pullback. In choppy or range-bound markets, the EMA slope can flip frequently and pullback signals may lead to whipsaws where price reverses through the stop. Tick volume in forex is a proxy for the number of price updates, not true traded contract volume, so the "dominance" reading is an approximation rather than an exact measure of order flow. The reward:risk target also means that a lower proportion of winning trades is required to stay balanced, but strings of losing trades are still entirely possible.
Where it may underperform. Expect weaker behaviour during low-liquidity periods (such as thin holiday sessions or the gap between market closes and opens), around high-impact news when spreads widen beyond MaxSpreadPoints, and in sideways markets where no durable trend exists to resume. Treat this EA as an educational tool for studying volume-and-trend confluence, not as a finished, hands-off solution.
Risk Management Tips
Sound risk management matters far more than any single entry rule. Consider these general principles as you study the strategy:
- Position sizing: Size each trade so that a single loss is a small, survivable fraction of your account. Many educators suggest risking no more than 1–2% of account equity per trade.
- Use a demo account first: Run the EA on a demo or paper account until you understand how it behaves across different sessions and market conditions.
- Understand drawdown: Every strategy experiences losing streaks. Study the maximum drawdown you could tolerate emotionally and financially before committing real capital.
- Mind the spread and costs: Spreads, commissions, and slippage all affect outcomes. The
MaxSpreadPointsfilter helps, but real trading costs still erode results. - Keep parameters realistic: Avoid over-optimising to historical data. A setting that looks ideal on past bars may not generalise to future conditions.
Risk Warning
Trading foreign exchange, CFDs, and other leveraged financial instruments involves substantial risk of loss and is not suitable for all investors. The strategies and tools discussed on this page are provided for educational purposes only and do not constitute financial advice, investment recommendations, or solicitation to trade. Always consult a qualified financial adviser before making trading decisions. Past backtest performance is not indicative of future results.
Downloads
- Expert Advisor: OpposingVolumeDominancePivot.ex5 (28 downloads)
- Source Code: OpposingVolumeDominancePivot.mq5 (22 downloads)
- Documentation: OpposingVolumeDominancePivot.pdf (26 downloads)