Disclaimer: This article is for educational and informational purposes only. It does not constitute financial or investment advice. Trading forex and CFDs carries significant risk of loss. Past performance of any strategy — including backtests — does not guarantee future results. Never trade with money you cannot afford to lose.
What Is This Strategy?
The Point Figure Column Breakout strategy is a trend-following Expert Advisor built around Point & Figure (P&F) charting, one of the oldest technical analysis methods in existence. Point & Figure is a time-independent charting technique: instead of plotting a price point for every bar, it discretises price into fixed-size "boxes" and only records movement that is large enough to matter. Rising price fills a column of Xs, falling price fills a column of Os, and a new column begins only when price reverses by a meaningful amount. This design intentionally throws away time and small intrabar wiggles, leaving a clean sequence of alternating up and down columns.
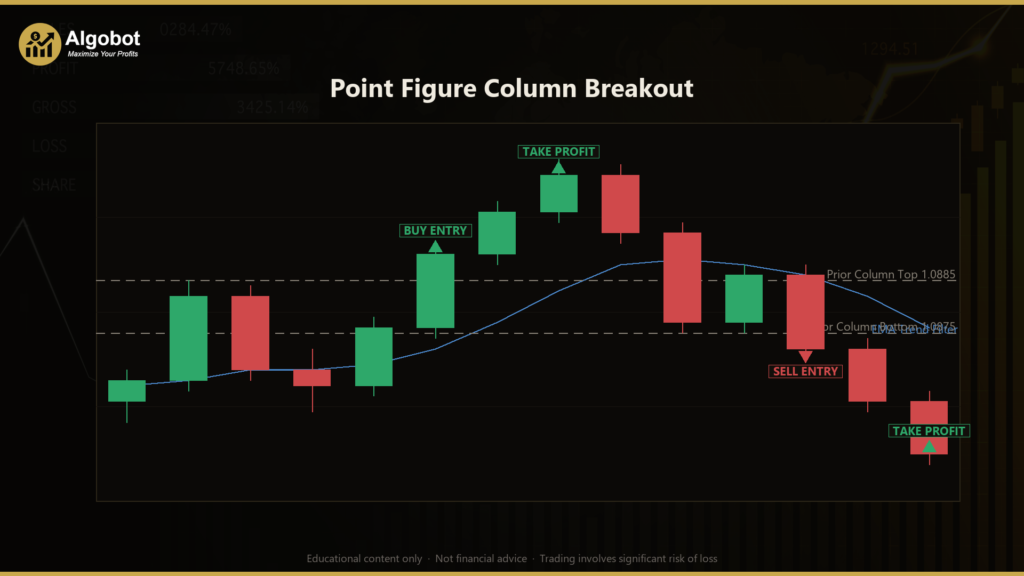
This strategy trades the two classic, textbook P&F signals. A double-top buy occurs when the current rising X column climbs one box above the top of the previous X column — a picture of higher highs on the discretised grid. A double-bottom sell occurs when the current falling O column drops one box below the bottom of the previous O column — lower lows on the grid. To keep entries aligned with the broader drift, the strategy adds an Exponential Moving Average (EMA) trend filter, and it sizes both stops and targets from the Average True Range (ATR), a standard measure of recent volatility.
As a learning tool, this EA is well suited to traders who want to understand how noise-filtering chart construction differs from candlestick breakouts, and how a breakout of a previously tested level can be defined objectively. It is designed for trending or breakout-prone conditions rather than tight, directionless ranges. Treat it as a study of pattern-based trend following — not as a profit opportunity.
How It Works
The strategy processes only completed bars (it acts once per newly-closed candle) and continuously maintains a Point & Figure grid in memory. Each finished bar's high and low are fed into that grid to either extend the current column or trigger a reversal into a new one.
- Adaptive box size: The box height is calculated as
ATR × BoxAtrFactor. Because ATR expands and contracts with volatility, the grid automatically scales to the instrument and the current market regime rather than using a fixed pip value. - Column continuation: While the current column is an up (X) column, a new box is added each time the bar's high pushes at least one box above the column's current top. A down (O) column extends similarly on new lows.
- Column reversal: A new column only starts when price moves against the current column by
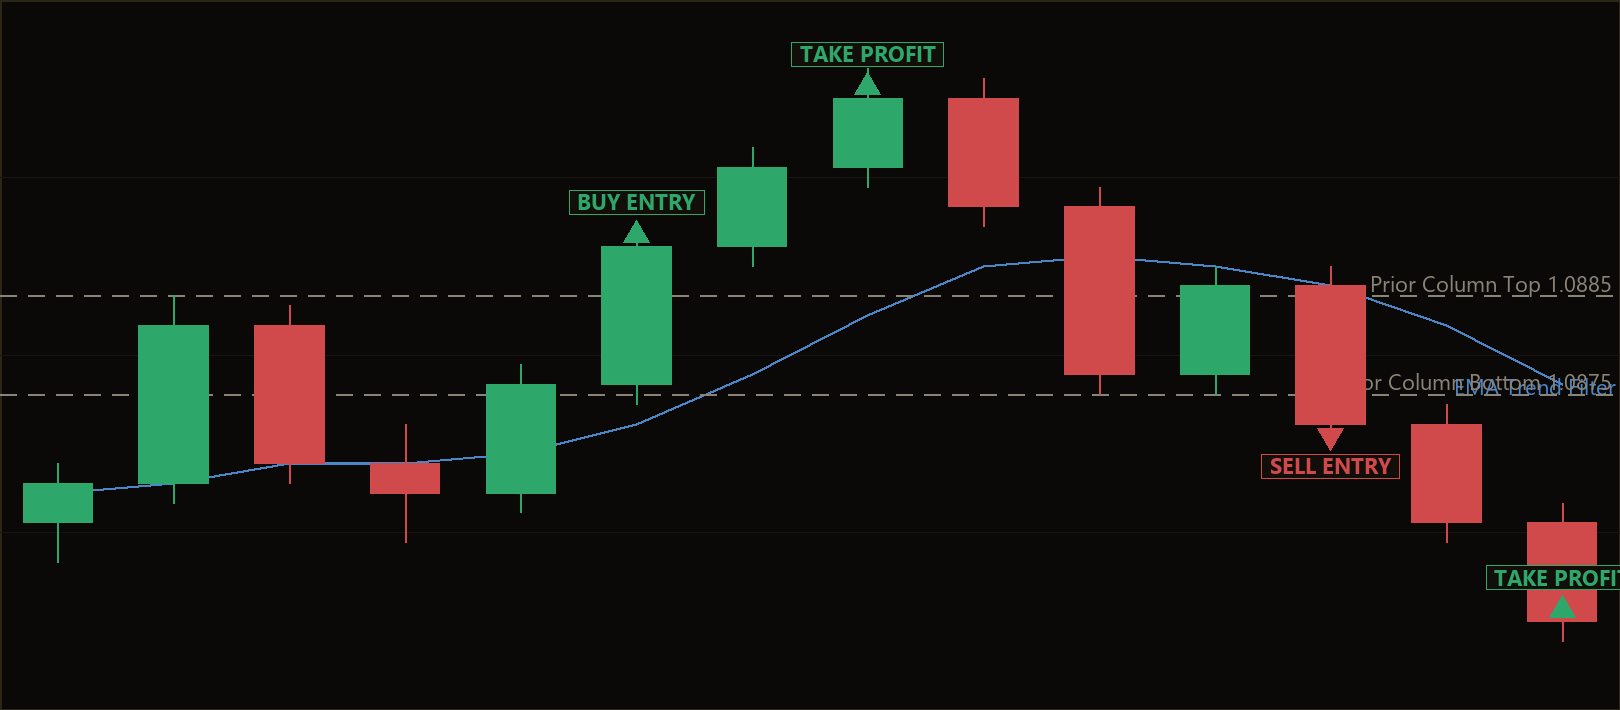
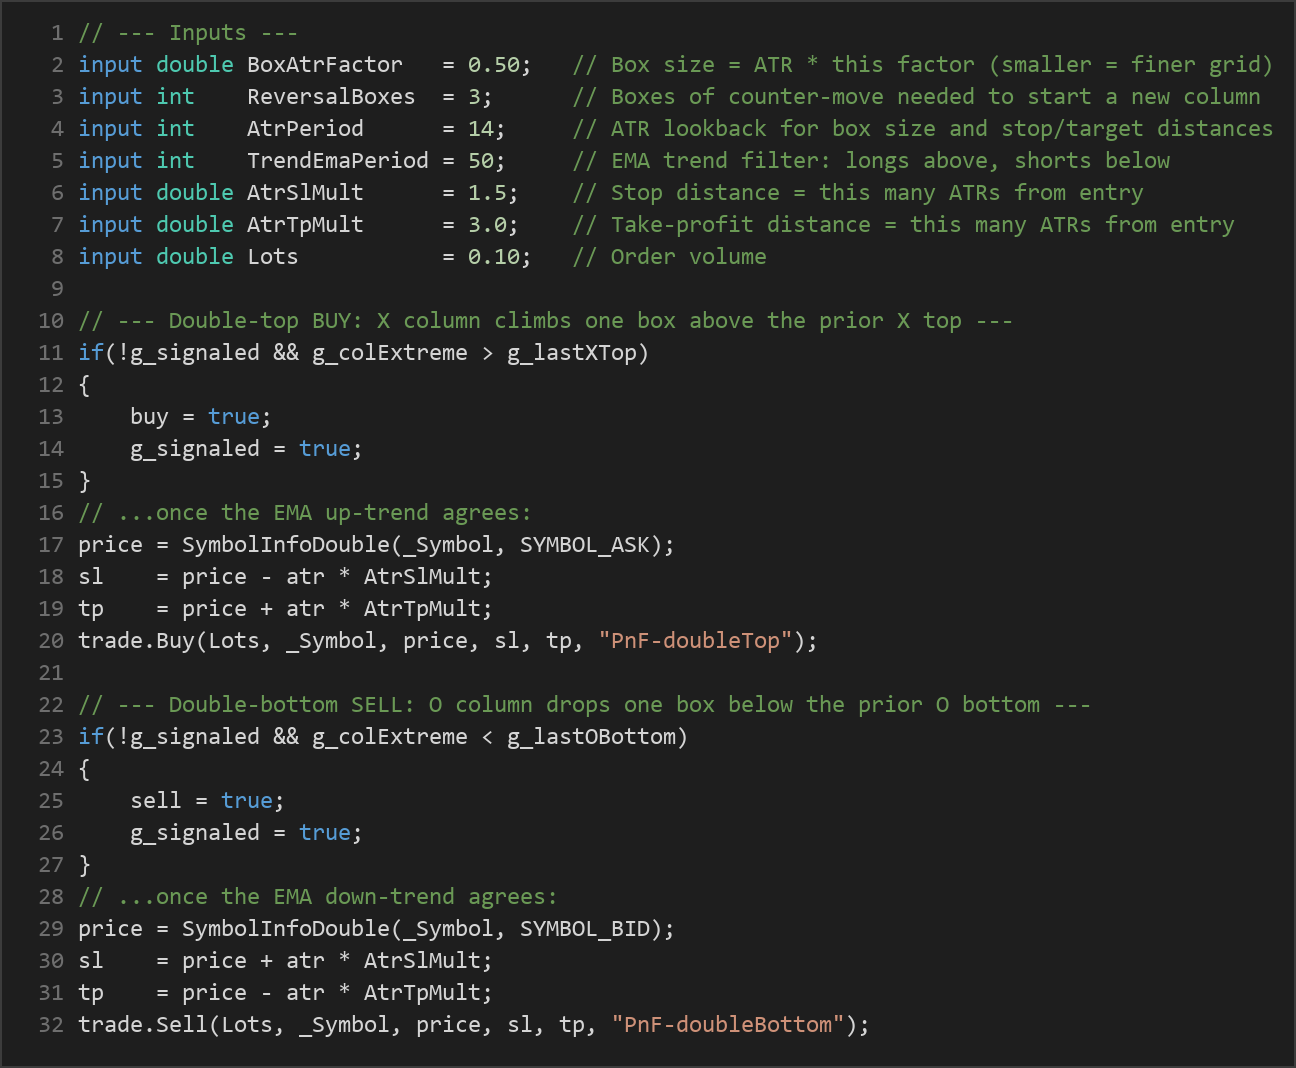
ReversalBoxes × boxsize. This reversal filter is what suppresses the intrabar chop that produces false breakouts on ordinary charts. - Double-top buy signal: The strategy signals a long when the extending X column rises one box above the top of the previous X column. Only the first such breakout in a column is taken (a flag prevents repeat signals in the same column).
- Double-bottom sell signal: The strategy signals a short when the extending O column falls one box below the bottom of the previous O column.
- EMA trend filter: A long signal is only acted upon when the completed bar's close is above the EMA; a short is only acted upon when the close is below it. This keeps trades aligned with the prevailing drift and filters counter-trend breakouts.
- One position at a time: The EA holds only a single position per symbol and magic number, avoiding stacked or overlapping trades.
For risk control, once an entry is triggered:
- Stop-loss: Placed
ATR × AtrSlMultaway from the entry price (below entry for longs, above for shorts). - Take-profit: Placed
ATR × AtrTpMultaway from entry, giving a volatility-scaled reward target.
Because both stop and target are derived from ATR, the distances widen in fast markets and tighten in quiet ones, keeping the risk framework proportional to current conditions. There is no additional trailing logic — each trade runs to its fixed ATR-based stop or target.
Strategy Parameters
| Parameter | Default | Min | Max | Description |
|---|---|---|---|---|
| BoxAtrFactor | 0.50 | 0.10 | 2.0 | Box size as a multiple of ATR. Smaller values create a finer grid and more frequent signals; larger values coarsen the grid and filter more noise. |
| ReversalBoxes | 3 | 1 | 6 | Number of boxes of counter-move required to start a new column. Higher values demand a larger reversal before flipping direction. |
| AtrPeriod | 14 | 5 | 50 | ATR lookback period used both for the box size and for the stop/target distances. |
| TrendEmaPeriod | 50 | 10 | 200 | EMA period for the trend filter. Longs are allowed only above it, shorts only below it. |
| AtrSlMult | 1.5 | 0.5 | 5.0 | Stop-loss distance expressed as a multiple of ATR from the entry price. |
| AtrTpMult | 3.0 | 0.5 | 8.0 | Take-profit distance expressed as a multiple of ATR from the entry price. |
| Lots | 0.10 | 0.01 | 1.0 | Fixed order volume (position size) in lots. |
Recommended Chart Settings
This strategy is designed to run on a single timeframe — whichever timeframe you attach it to is the one it uses for every calculation. Because Point & Figure already filters noise through its box and reversal mechanism, a common starting point for study is the H1 (1-hour) or H4 (4-hour) timeframe on a liquid instrument such as a major forex pair (for example, EUR/USD) or a widely-traded index CFD. Higher timeframes tend to produce cleaner columns and fewer, more deliberate signals.
Keep in mind that the adaptive box size means the grid behaves differently across instruments and volatility regimes. Results will vary considerably between symbols, timeframes, and market conditions, so always test any configuration on your own data before drawing conclusions.
How to Install on MetaTrader 5
- Download the .ex5 file from the link below
- Copy it to your MT5
MQL5\Expertsfolder - Restart MetaTrader 5 or refresh the Navigator panel
- Drag the EA onto a chart matching the recommended symbol and timeframe
- Configure the input parameters and enable Algo Trading
What to Consider Before Using This EA
Strengths of the approach. Point & Figure's biggest contribution is objectivity. A double-top or double-bottom breakout on a P&F grid is defined by exact box levels, not by subjective pattern-drawing. Because the reversal filter ignores minor pullbacks, a breakout typically marks a level that has already been tested and held, which many traders consider a higher-quality signal than a raw candlestick break. The adaptive, ATR-based box size means the grid self-scales, and the EMA filter helps avoid the most obvious counter-trend entries.
Known limitations. Like all breakout systems, this strategy is vulnerable to whipsaws in choppy, range-bound markets where price repeatedly triggers a breakout and then reverses. The box and reversal filters reduce this but cannot eliminate it. Point & Figure is also inherently a lagging construction — it confirms a move only after price has already travelled at least one box beyond the reference level, so entries occur after the initial thrust. The fixed ATR take-profit means the strategy will exit strong trends early sometimes, while the fixed stop offers no partial protection once price moves in your favour.
When it may underperform. Expect weaker behaviour during low-volatility consolidation, during news-driven spikes that gap through stops, and on instruments with wide spreads relative to the ATR-based box size. Parameter choices matter a great deal: a very small BoxAtrFactor will generate many marginal signals, while a very large one may produce too few to be meaningful. Treat parameter tuning as a research exercise, not a search for a single "best" setting.
Risk Management Tips
Sound risk management matters more than any single entry rule. Consider these general principles:
- Risk a small, fixed fraction per trade. Many educational sources suggest risking no more than 1–2% of account equity on any single position. Adjust the
Lotsparameter so the ATR-based stop distance corresponds to that fraction, rather than trading a fixed lot size blindly. - Understand drawdown. Even a well-designed trend strategy will experience losing streaks. Study the maximum historical drawdown before committing capital, and ask whether you could tolerate that decline emotionally and financially.
- Start on a demo account. Run the EA on a demo or in the Strategy Tester first to understand its trade frequency, behaviour, and typical hold times without risking real money.
- Account for costs. Spreads, commissions, and slippage can meaningfully affect a breakout strategy, especially on lower timeframes. Include realistic costs in any testing.
- Diversify and avoid over-leverage. Concentrating too much capital in one instrument or using excessive leverage magnifies both gains and losses.
Risk Warning
Trading foreign exchange, CFDs, and other leveraged financial instruments involves substantial risk of loss and is not suitable for all investors. The strategies and tools discussed on this page are provided for educational purposes only and do not constitute financial advice, investment recommendations, or solicitation to trade. Always consult a qualified financial adviser before making trading decisions. Past backtest performance is not indicative of future results.
Downloads
- Expert Advisor: PointFigureColumnBreakout.ex5 (26 downloads)
- Source Code: PointFigureColumnBreakout.mq5 (30 downloads)
- Documentation: PointFigureColumnBreakout.pdf (32 downloads)