Disclaimer: This article is for educational and informational purposes only. It does not constitute financial or investment advice. Trading forex and CFDs carries significant risk of loss. Past performance of any strategy — including backtests — does not guarantee future results. Never trade with money you cannot afford to lose.
What Is This Strategy?
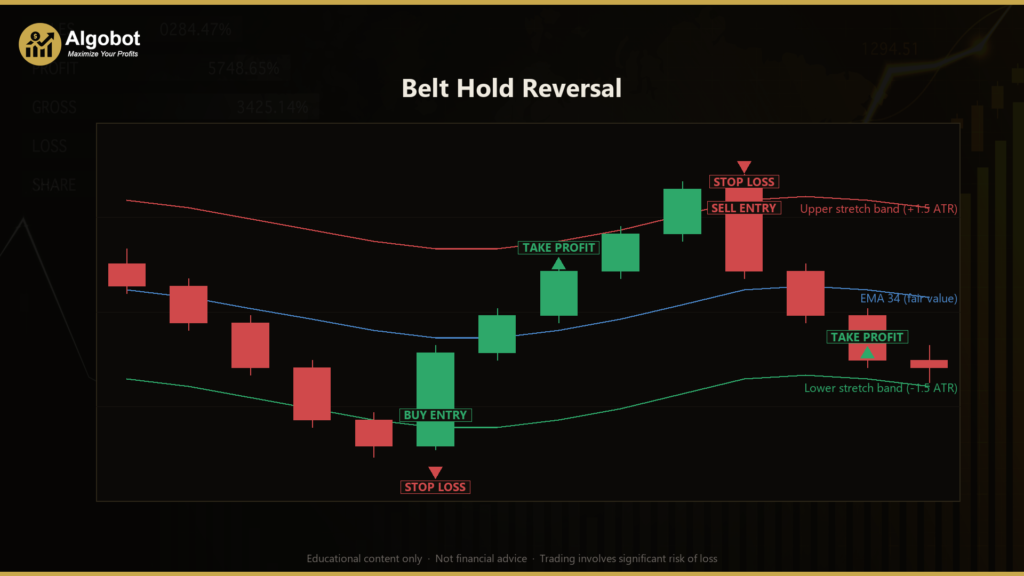
The Belt Hold Reversal strategy is a counter-trend candlestick mean-reversion system built around the belt-hold line — a classic Japanese candlestick pattern also known as the opening marubozu or yorikiri. A belt-hold is a bar that opens at one extreme of its range with essentially no wick on the opening side, then travels decisively to the far end and closes there. In plain terms, one side of the market seizes control from the very first tick and never lets go for the duration of that candle. This strategy pairs that pattern with two well-known technical indicators: an Exponential Moving Average (EMA), which is a moving average that weights recent prices more heavily to define a "fair value" baseline, and the Average True Range (ATR), a volatility measure that gauges how far price is stretched from that baseline.
On its own, a belt-hold candle fires constantly and means very little inside choppy, sideways markets. The edge this strategy seeks comes entirely from context. It only acts on a belt-hold when price has already become over-extended — stretched far away from the EMA as measured in ATR units. The reasoning is that a sudden, wickless seizure of control appearing precisely when the crowd is stretched thin may indicate the point where an exhausted move snaps back, trapping late chasers against fresh initiative.
This is a learning tool best suited to traders who want to study how candlestick geometry can be filtered by volatility and trend context rather than traded blindly. It was designed with pairs like GBP/USD and the metal XAU/USD (gold) on intraday charts in mind, but it reads every bar generically and can be tested on any liquid instrument. Because it is a fade — a counter-trend approach — it is intended for study of mean-reverting behaviour, not momentum chasing.
How It Works
The strategy evaluates each freshly-closed candle (the "signal bar") and checks whether the belt-hold geometry and the stretch gate line up together. It holds only one position at a time.
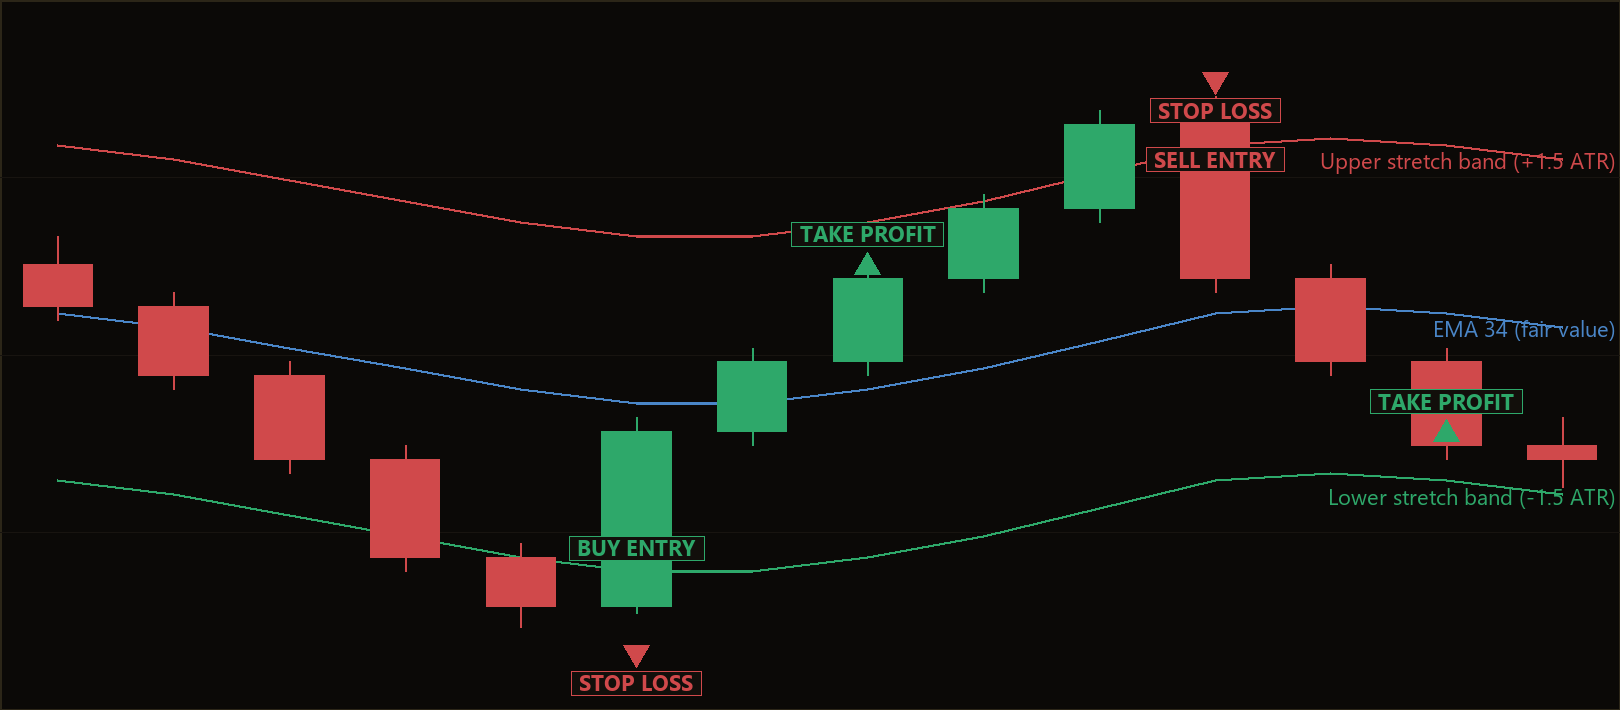
Long entry (bullish belt-hold ending a down-stretch):
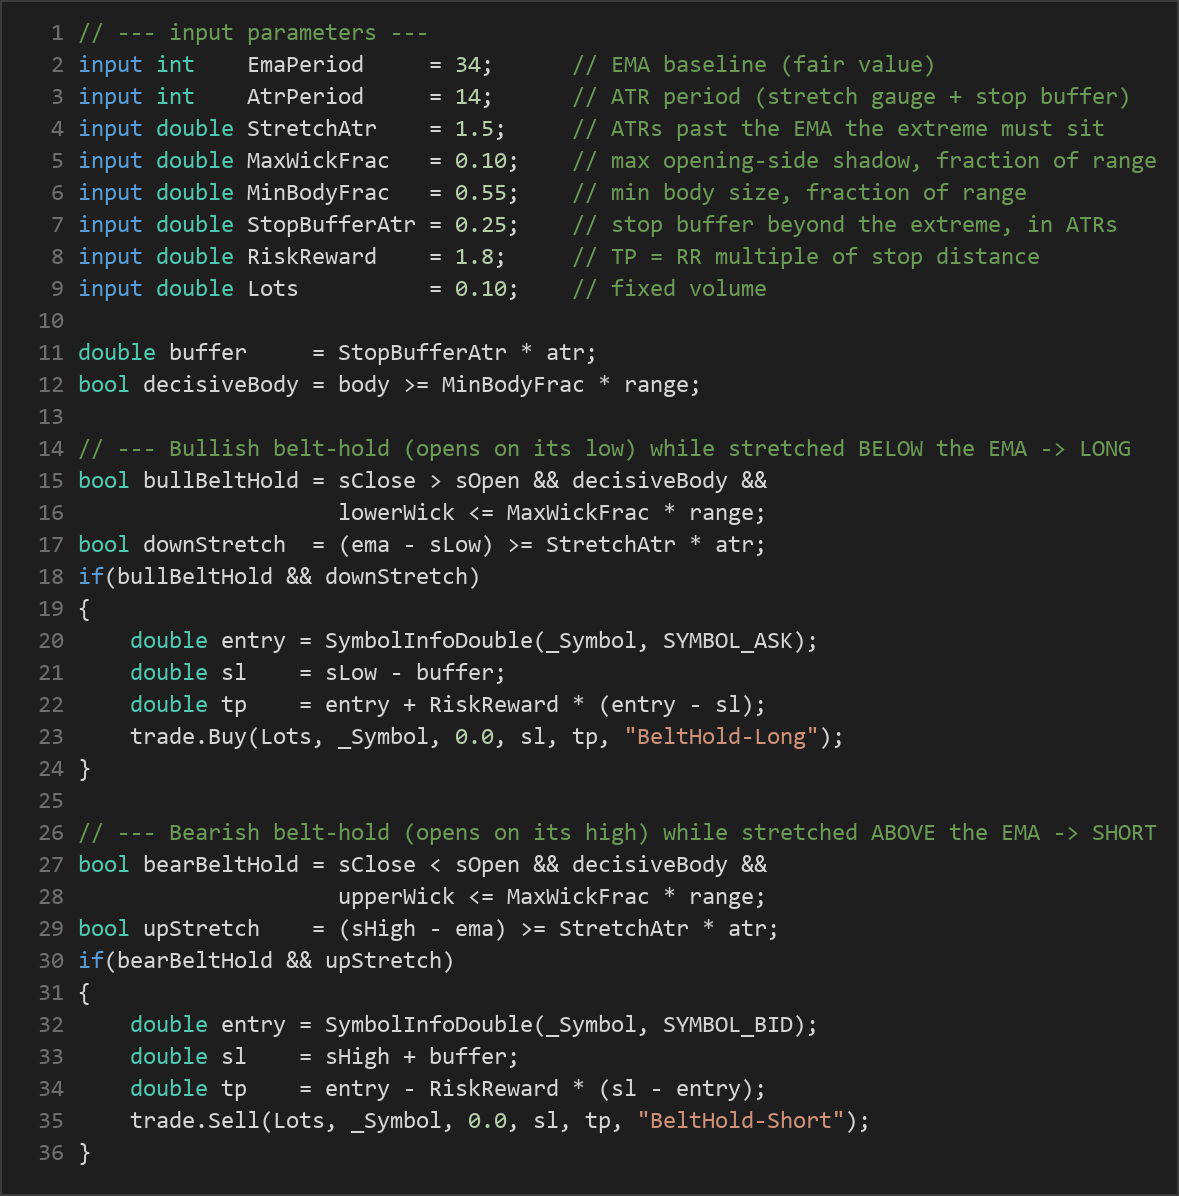
- Stretch gate: the distance from the EMA down to the signal bar's low is at least
StretchAtr× ATR, meaning price is over-extended below fair value. - Bullish body: the candle closes above where it opened.
- Tiny lower shadow: the shadow below the body is no more than
MaxWickFracof the candle's total range — the bar effectively opened right at its low. - Decisive body: the body spans at least
MinBodyFracof the total range, confirming price travelled convincingly toward the high. - When all conditions align, the strategy signals a buy, anticipating a snap-back upward.
Short entry (bearish belt-hold ending an up-stretch): the exact mirror image.
- The distance from the signal bar's high up to the EMA is at least
StretchAtr× ATR (over-extended above fair value). - The candle is bearish (closes below its open), has a tiny upper shadow (opened near its high), and shows a decisive body.
- When aligned, the strategy signals a sell, anticipating a snap-back downward.
Stop-loss logic:
- For longs, the stop is placed just below the belt-hold candle's low, with an additional buffer of
StopBufferAtr× ATR. - For shorts, the stop sits just above the belt-hold candle's high, plus the same ATR buffer.
- Placing the stop beyond the candle extreme means the trade is invalidated if the wickless seizure of control is itself broken.
Take-profit logic:
- The take-profit is set at a fixed reward-to-risk multiple (
RiskReward) of the measured stop distance. For example, with the default of 1.8, the target sits 1.8 times as far from entry as the stop. - Position size is fixed by the
Lotsparameter.
Strategy Parameters
| Parameter | Default | Min | Max | Description |
|---|---|---|---|---|
| EmaPeriod | 34 | 10 | 120 | Period of the EMA baseline that defines the "fair value" the stretch is measured from. |
| AtrPeriod | 14 | 5 | 40 | ATR period used for both the stretch gauge and the stop-loss buffer. |
| StretchAtr | 1.5 | 0.5 | 4.0 | How many ATRs past the EMA the belt-hold extreme must sit — the over-extension gate. |
| MaxWickFrac | 0.10 | 0.0 | 0.30 | Maximum shadow on the opening side, as a fraction of the candle range (belt-hold ≈ 0). |
| MinBodyFrac | 0.55 | 0.30 | 0.90 | Minimum body size as a fraction of range — confirms decisive travel to the far end. |
| StopBufferAtr | 0.25 | 0.0 | 1.0 | Extra stop-loss buffer beyond the belt-hold extreme, expressed in ATRs. |
| RiskReward | 1.8 | 1.0 | 5.0 | Take-profit distance as a reward-to-risk multiple of the stop distance. |
| Lots | 0.10 | 0.01 | 1.0 | Fixed trade volume in lots. |
Recommended Chart Settings
The Belt Hold Reversal strategy was designed with GBP/USD and XAU/USD (gold) on the M15 and M30 timeframes in mind. These instruments and timeframes tend to produce the kind of sharp intraday stretches and clean candle geometry the strategy looks for. That said, the code reads every bar generically and runs on any liquid symbol and timeframe you select at backtest time.
Keep in mind that results will vary considerably across different symbols, timeframes, and market conditions. What behaves well on one pair during one volatility regime may behave very differently elsewhere. Always test any configuration on historical data and a demo account before drawing conclusions.
How to Install on MetaTrader 5
- Download the .ex5 file from the link below
- Copy it to your MT5
MQL5\Expertsfolder - Restart MetaTrader 5 or refresh the Navigator panel
- Drag the EA onto a chart matching the recommended symbol and timeframe
- Configure the input parameters and enable Algo Trading
What to Consider Before Using This EA
Strengths of the approach. The strategy's core idea is disciplined: it refuses to trade the belt-hold pattern in isolation and instead requires a measurable volatility stretch before acting. This context filter historically helps screen out the constant, meaningless belt-hold signals that appear inside chop. The entry, stop, and target are all defined objectively in ATR terms, which removes discretionary guesswork and makes the logic reproducible and testable. The fixed reward-to-risk structure also enforces a consistent trade profile.
Known limitations. This is a counter-trend fade, and fading is inherently difficult. A strong trend can remain over-extended far longer than any single ATR measurement suggests, and belt-hold reversals printed against powerful momentum can be run over repeatedly. The strategy assumes that stretch implies exhaustion — but stretch can equally signal an accelerating breakout, in which case the fade is on the wrong side. Because it takes only one position at a time and waits for a fairly specific candle shape plus a stretch condition, signals can be infrequent, which makes it slow to gather a statistically meaningful sample.
Where it may underperform. Persistent trending environments, news-driven expansions, and low-liquidity sessions with erratic wicks can all degrade this pattern-plus-gate logic. The belt-hold geometry is also sensitive to how a given broker's feed prints opens and closes, so the same chart on two brokers may generate slightly different signals. Treat this EA as a framework for studying how candlestick triggers interact with volatility context — not as a finished, turnkey system.
Risk Management Tips
Sound risk management matters more than any single entry signal. Consider these general principles as you study this strategy:
- Risk a small, fixed fraction per trade. Many educators suggest risking no more than 1–2% of account equity on any single position, so that a string of losses cannot cripple the account.
- Size positions to your stop, not the other way around. The
Lotsparameter here is fixed, so review whether that volume is appropriate for your account size and the ATR-based stop distance on your chosen symbol. - Practise on a demo account first. Run the strategy on a demo or simulated environment until you understand its signal frequency and behaviour across different market conditions.
- Understand drawdown. Every strategy experiences losing streaks. Study the historical drawdown so you know what a normal rough patch looks like and can avoid abandoning the plan at the worst moment.
- Never risk money you cannot afford to lose, and keep leverage conservative — leverage magnifies losses just as much as gains.
Risk Warning
Trading foreign exchange, CFDs, and other leveraged financial instruments involves substantial risk of loss and is not suitable for all investors. The strategies and tools discussed on this page are provided for educational purposes only and do not constitute financial advice, investment recommendations, or solicitation to trade. Always consult a qualified financial adviser before making trading decisions. Past backtest performance is not indicative of future results.
Downloads
- Expert Advisor: BeltHoldReversal.ex5 (33 downloads)
- Source Code: BeltHoldReversal.mq5 (33 downloads)
- Documentation: BeltHoldReversal.pdf (37 downloads)