Disclaimer: This article is for educational and informational purposes only. It does not constitute financial or investment advice. Trading forex and CFDs carries significant risk of loss. Past performance of any strategy — including backtests — does not guarantee future results. Never trade with money you cannot afford to lose.
What Is This Strategy?
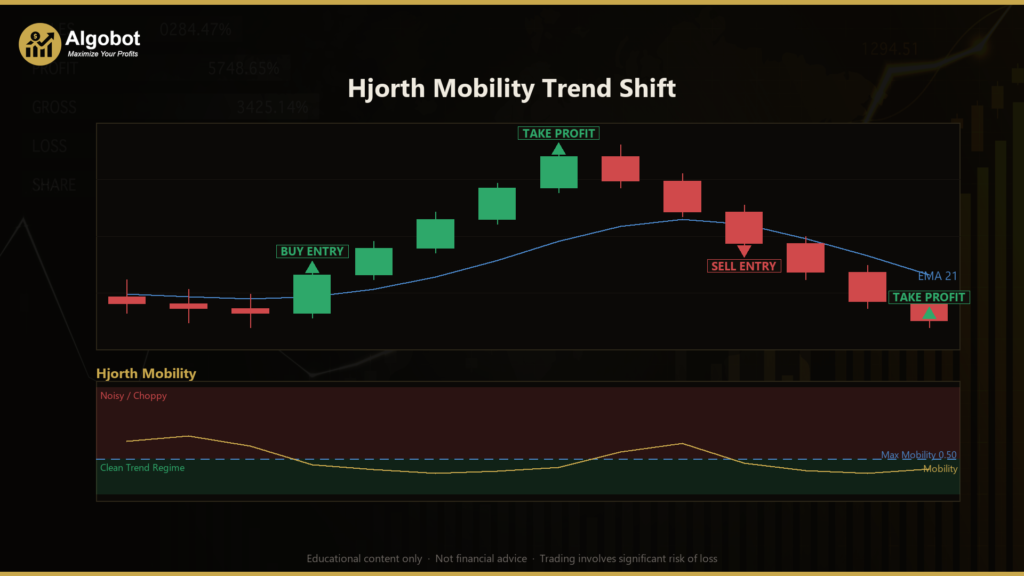
The Hjorth Mobility Trend Shift is a regime-gated trend-following strategy for MetaTrader 5 built around the Hjorth descriptors — a trio of signal-processing statistics (Activity, Mobility, and Complexity) originally developed for analysing EEG and other time-series signals. Rather than reading price with a conventional oscillator, this strategy treats the sequence of closing prices as a signal and measures its shape: how fast it oscillates and how "clean" or single-toned that oscillation is. It then trades the moment the market transitions from noisy chop into a smooth, directional regime.
At the heart of the system are two derived measures. Mobility is proportional to the dominant frequency of the price signal — a low Mobility reading means the series is evolving slowly and smoothly (few sign changes per bar), which tends to accompany a directional trend. Complexity measures the signal's bandwidth, or how far it departs from a single clean frequency — a low Complexity reading suggests a tidy, high-conviction impulse leg rather than broadband noise. Because both are built purely from the variance of the price series and its successive differences, they are completely scale-invariant, meaning the same thresholds are comparable across different symbols and timeframes.
This strategy is best understood as a learning tool for traders who want to explore how ideas from digital signal processing can be applied to markets. It is designed for markets that alternate between congestion and trending phases, and it aims to catch the birth of a fresh directional leg as it emerges out of a range. If you are studying regime detection, filtering techniques, or how to combine a statistical gate with a simple directional filter, this strategy offers a compact and transparent example.
How It Works
The strategy processes one completed bar at a time on the chart's primary timeframe. On each new bar it computes the Hjorth Mobility and Complexity over a rolling window of recent closes, reads the direction of an Exponential Moving Average (EMA), and checks whether the "clean trend regime" has just switched on.
- Regime definition: A bar is considered part of a clean trend regime when Mobility is at or below
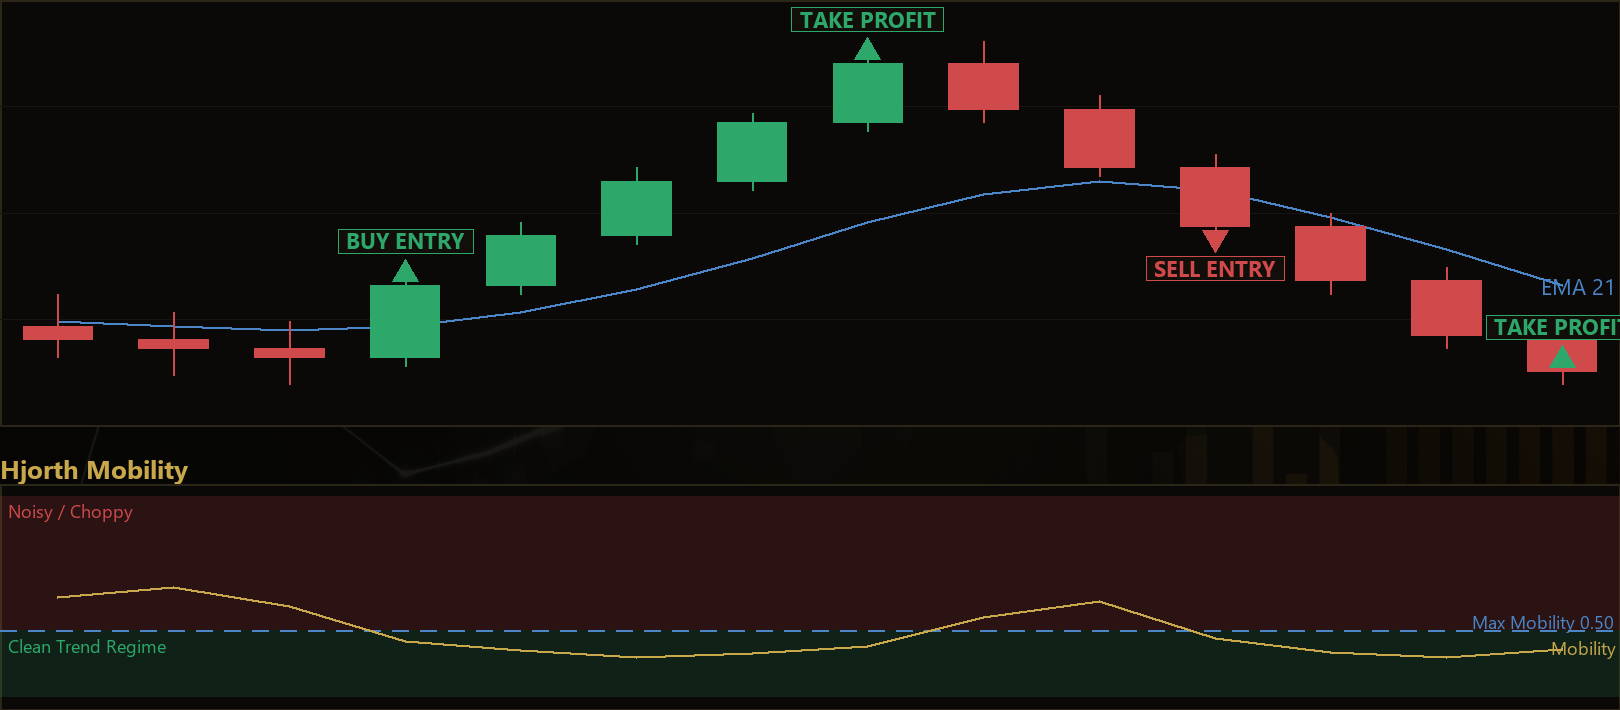
MaxMobility(the signal is slow enough to be trending) AND Complexity is at or belowMaxComplexity(the leg is close to a single clean frequency rather than broadband chop). - The entry trigger — a fresh transition: The strategy only acts on the transition into that regime. When the current bar is clean but the previous bar was not (a fresh cross from noisy → clean), it treats this as the possible birth of a new directional leg.
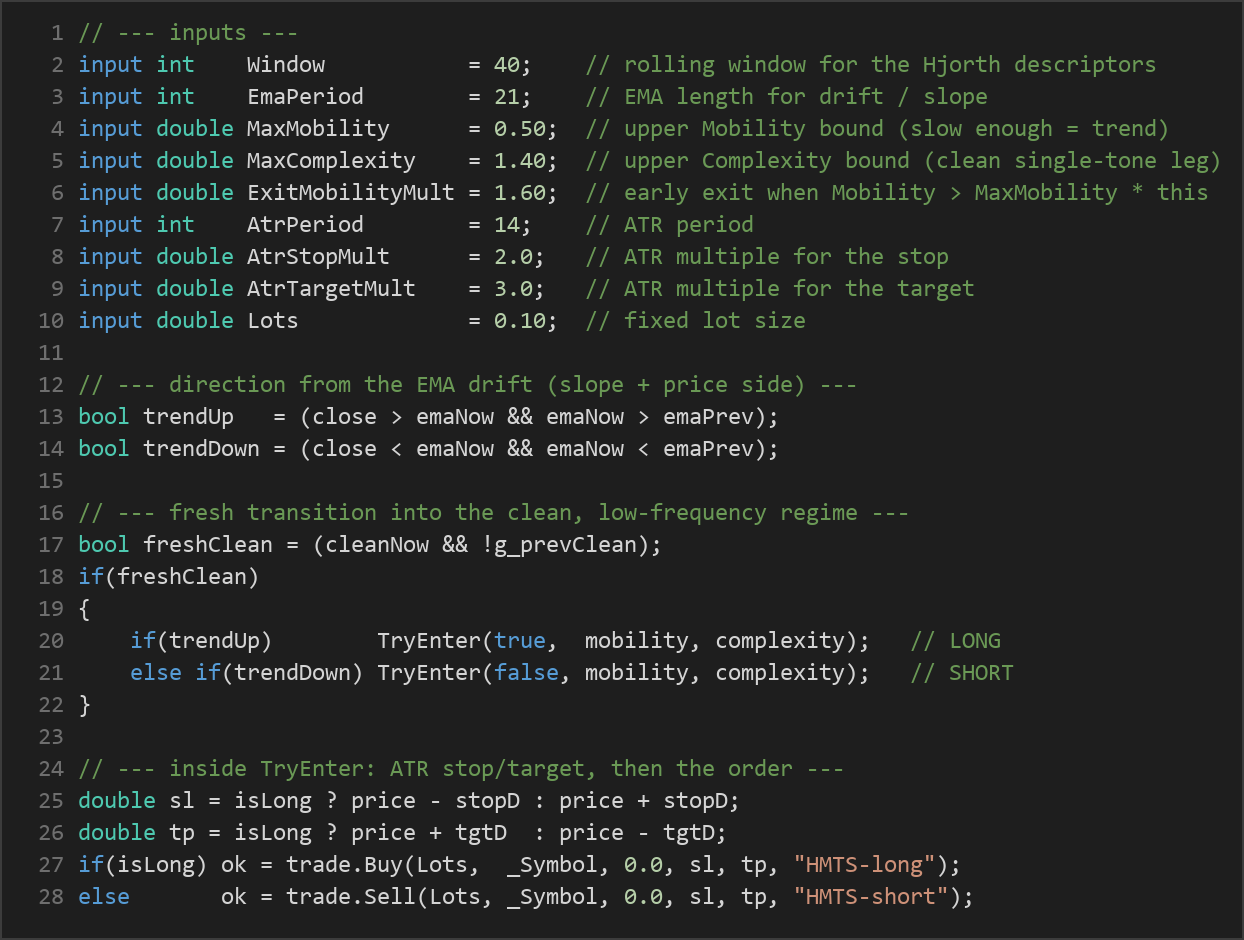
- Long entry: The strategy signals a long when the regime has just turned clean this bar and the close is above a rising EMA (price above the EMA and the EMA sloping up).
- Short entry: The strategy signals a short when the regime has just turned clean this bar and the close is below a falling EMA (price below the EMA and the EMA sloping down).
- Directional filter: The EMA slope and the price's position relative to the EMA together define the prevailing drift, so trades are always taken in the direction of the existing trend rather than against it. The logic is fully symmetric for longs and shorts.
- Stop-loss: On entry, a stop is placed at a distance of
AtrStopMult× ATR (Average True Range, a volatility measure) from the entry price. This scales the risk to current market volatility. - Take-profit: A target is placed at
AtrTargetMult× ATR from entry. With the default settings, the target is wider than the stop, giving a reward-to-risk ratio greater than one. - Early regime-failure exit: While a position is open, the strategy watches Mobility. If Mobility blows back out past
MaxMobility×ExitMobilityMult, the clean signal is judged to have degraded back into noise, the leg is considered over, and the position is closed early — before the fixed stop or target may be reached. - One position at a time: The strategy holds only a single position per magic number and never stacks trades.
Strategy Parameters
| Parameter | Default | Min | Max | Description |
|---|---|---|---|---|
| Window | 40 | 20 | 90 | Rolling window (in bars) over which the Hjorth descriptors are computed. |
| EmaPeriod | 21 | 8 | 60 | Length of the EMA used to read the drift direction and slope. |
| MaxMobility | 0.50 | 0.10 | 1.50 | Upper Mobility bound; below it the signal is slow enough to be treated as a trend. |
| MaxComplexity | 1.40 | 1.00 | 3.00 | Upper Complexity bound; below it the leg is treated as a clean single-frequency move. |
| ExitMobilityMult | 1.60 | 1.10 | 3.00 | Early-exit multiple; the position is closed when Mobility exceeds MaxMobility × this value. |
| AtrPeriod | 14 | 7 | 40 | Period of the ATR used for the stop and target distances. |
| AtrStopMult | 2.0 | 1.0 | 5.0 | ATR multiple that sets the stop-loss distance. |
| AtrTargetMult | 3.0 | 1.0 | 8.0 | ATR multiple that sets the take-profit distance. |
| Lots | 0.10 | 0.01 | 1.0 | Fixed trade volume in lots. |
Recommended Chart Settings
The strategy is timeframe-agnostic by design: every calculation uses the chart's primary timeframe, so nothing is hardcoded and the descriptors automatically adapt to whichever timeframe you apply. A common starting point for study is a major forex pair such as EUR/USD on the H1 (1-hour) timeframe, which offers a balance between signal frequency and noise. Because the Hjorth descriptors are scale-invariant, the same default thresholds can be tested across other symbols and timeframes without rescaling. Keep in mind that results will vary considerably across different instruments and market conditions, so any timeframe you choose should be evaluated on its own merits during testing.
How to Install on MetaTrader 5
- Download the .ex5 file from the link below
- Copy it to your MT5
MQL5\Expertsfolder - Restart MetaTrader 5 or refresh the Navigator panel
- Drag the EA onto a chart matching the recommended symbol and timeframe
- Configure the input parameters and enable Algo Trading
What to Consider Before Using This EA
The main strength of this approach is the way it separates two distinct questions: is the market in a trending state? (answered by Mobility and Complexity) and which direction should I trade? (answered by the EMA). Because the Hjorth descriptors are scale-invariant and derived only from variance ratios, the regime gate behaves consistently across instruments, and the "fresh transition" logic is deliberately conservative — it waits for congestion to resolve into a clean leg rather than trading every wiggle. The early regime-failure exit is also a thoughtful touch, since it can cut a trade loose when the underlying signal deteriorates rather than always waiting for a fixed stop.
There are also real limitations to understand. Any transition-based system depends on threshold choices: set MaxMobility or MaxComplexity too loosely and the regime gate opens during noise; set them too tightly and genuine trends may never qualify. The strategy uses closing-price variance, so it can be sensitive to how a particular broker's bars are formed and to gaps. Like most trend-following logic, it may underperform in persistently choppy, range-bound markets, where "clean" regimes repeatedly form and then fail, producing a string of small losses or early exits. News-driven volatility spikes can also distort the variance measures for several bars. Finally, the fixed lot size and single-position rule mean position sizing and exposure must be managed thoughtfully rather than assumed. Treat this EA as a framework to study and stress-test, not a finished system to deploy unexamined.
Risk Management Tips
Sound risk management matters more than any single entry signal. Consider the following general principles as part of your education:
- Risk a small, fixed fraction per trade. Many educational sources suggest risking no more than 1–2% of account equity on any single position, and sizing your lots so that the ATR-based stop distance corresponds to that fraction.
- Test on a demo account first. Run the strategy on a demo or paper account across many market conditions before ever considering real capital, so you can observe how it behaves through both trending and ranging phases.
- Understand drawdown. Every strategy experiences losing streaks. Study the sequence of losses, not just the wins, and ask whether you could tolerate the worst historical drawdown emotionally and financially.
- Match position size to volatility. Because stops here scale with ATR, your monetary risk per trade changes as volatility changes; review your lot size when volatility shifts materially.
- Avoid over-optimising. Tuning the parameters until a backtest looks ideal often produces a curve-fit that fails on new data. Favour robust settings that work reasonably across a range of values.
- Keep leverage modest. Lower effective leverage reduces the chance that a normal losing streak becomes an account-ending event.
Risk Warning
Trading foreign exchange, CFDs, and other leveraged financial instruments involves substantial risk of loss and is not suitable for all investors. The strategies and tools discussed on this page are provided for educational purposes only and do not constitute financial advice, investment recommendations, or solicitation to trade. Always consult a qualified financial adviser before making trading decisions. Past backtest performance is not indicative of future results.
Downloads
- Expert Advisor: HjorthMobilityTrendShift.ex5 (28 downloads)
- Source Code: HjorthMobilityTrendShift.mq5 (32 downloads)
- Documentation: HjorthMobilityTrendShift.pdf (34 downloads)