
Disclaimer: This article is for educational and informational purposes only. It does not constitute financial or investment advice. Trading forex and CFDs carries significant risk of loss. Past performance of any strategy — including backtests — does not guarantee future results. Never trade with money you cannot afford to lose.
What Is This Strategy?
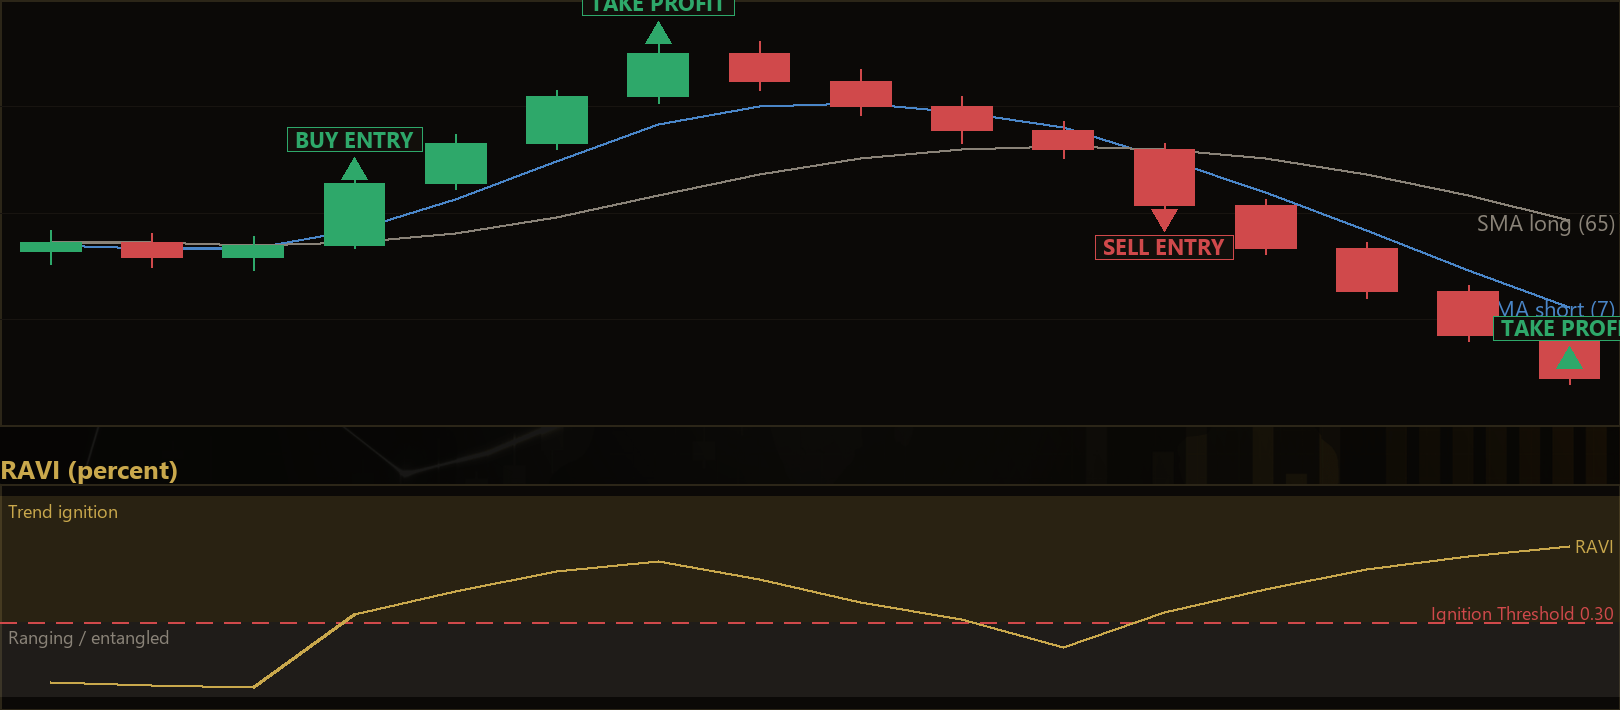
Range Action Trend Ignition is a trend-following expert advisor built around Tushar Chande's RAVI (Range Action Verification Index) used as a regime-ignition trigger. RAVI measures the distance between a short and a long simple moving average, normalized as a percentage of price, giving you a clean, direction-blind reading of how much "directional action" the market is producing. When that reading is low, the two averages are entangled and the market is ranging; when it climbs decisively, a trend is separating out of consolidation. This strategy is designed to catch that exact transition — the moment a trend ignites — rather than to chase a move that has already run.
The core idea is that most of a trend's easy movement happens early, right as price breaks free from a choppy, sideways phase. A simple moving average (SMA) is the running average of closing prices over a set number of bars, and RAVI reads the gap between a fast SMA and a slow SMA. Because RAVI uses the absolute divergence, it tells you trend strength but not trend direction — so the strategy separately reads the sign of that divergence to decide whether to buy or sell. This makes RAVI mathematically distinct from popular regime gauges like the ADX, the Choppiness Index, or the Vertical Horizontal Filter.
As a learning tool, Range Action Trend Ignition is well suited to traders who want to understand how a volatility- and trend-strength filter can be converted into an active entry trigger instead of a passive gate. It illustrates concepts every systematic trader should grasp: acting on a fresh threshold cross, confirming direction with price structure, framing risk with the Average True Range (ATR), and — importantly — cutting a position early when the premise that opened it disappears. Frame this as a study in strategy design, not as a shortcut to trading success.
How It Works
The strategy operates only on fully-closed bars of the chart's primary timeframe, so it evaluates its logic once per bar rather than reacting to every tick. Here is what happens on each newly-closed bar:
- RAVI calculation: The strategy computes
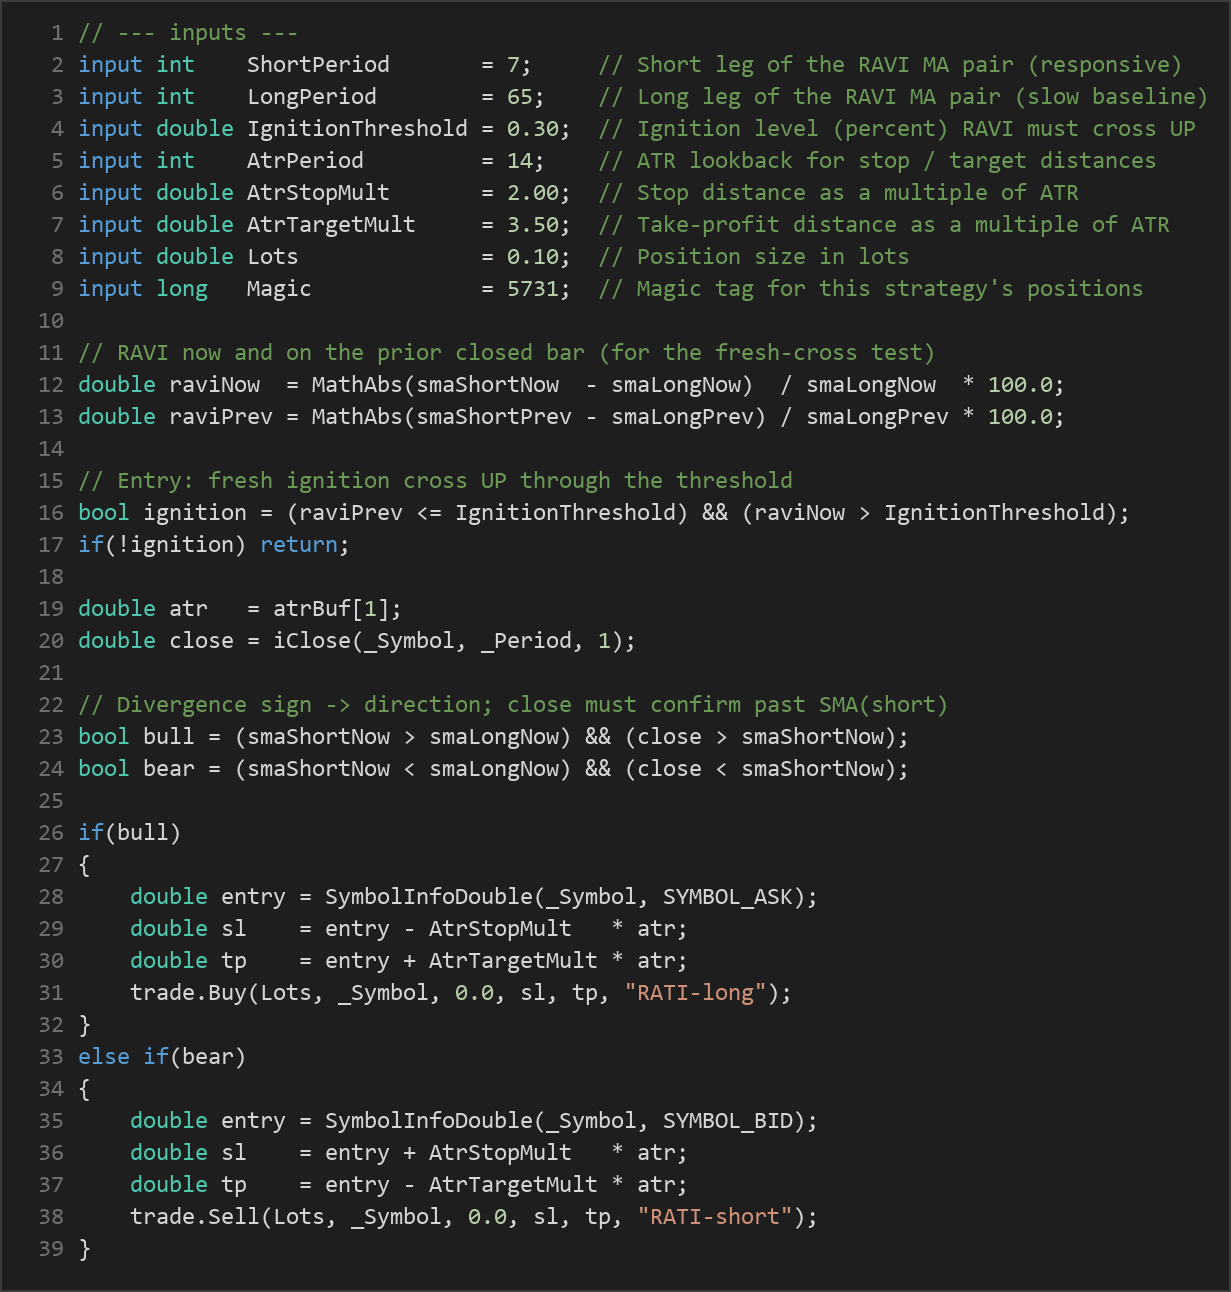
RAVI = |SMA(short) − SMA(long)| / SMA(long) × 100for the just-closed bar and for the prior closed bar. These two values let it test for a fresh cross rather than a stale, already-elevated reading. - Ignition trigger (entry condition): A signal fires only when RAVI was at or below the IgnitionThreshold on the prior bar and has pushed above it on the just-closed bar. This "cross up" marks the moment the averages decisively separate — the ignition transition — so the strategy acts early in the new leg.
- Direction confirmation: Because RAVI is direction-blind, the sign of the moving-average divergence sets direction, and the closing price must confirm it:
- The strategy signals a long when the short SMA is above the long SMA (averages fanned bullishly) and the close finishes above the short SMA.
- The strategy signals a short when the short SMA is below the long SMA (averages fanned bearishly) and the close finishes below the short SMA.
- Stop-loss logic: On entry, the strategy places a protective stop at a distance of AtrStopMult × ATR from the entry price. ATR (Average True Range) measures recent volatility, so the stop automatically widens in fast markets and tightens in quiet ones.
- Take-profit logic: A profit target is set at AtrTargetMult × ATR from entry. With the default multipliers (2.00 stop, 3.50 target), the framework aims for a reward-to-risk structure greater than one-to-one.
- Ignition-failure exit: In a concept-consistent twist, the strategy also closes an open position early if RAVI collapses back below the threshold before the stop or target is hit. The interpretation is that the ignition fizzled and the trend never materialized, so the position is stood aside rather than left to drift.
- One position per magic: The EA holds at most one position at a time (tracked by its Magic number) and does not stack new entries on top of an existing trade.
Strategy Parameters
| Parameter | Default | Min | Max | Description |
|---|---|---|---|---|
| ShortPeriod | 7 | 3 | 20 | Length of the short (responsive) SMA leg of the RAVI pair. |
| LongPeriod | 65 | 25 | 120 | Length of the long (slow baseline) SMA leg of the RAVI pair. |
| IgnitionThreshold | 0.30 | 0.05 | 2.00 | Ignition level in percent; RAVI must cross up through this to fire an entry. |
| AtrPeriod | 14 | 5 | 40 | Lookback used for the ATR that sizes stop and target distances. |
| AtrStopMult | 2.00 | 0.50 | 5.00 | Stop-loss distance expressed as a multiple of ATR. |
| AtrTargetMult | 3.50 | 1.00 | 8.00 | Take-profit distance expressed as a multiple of ATR. |
| Lots | 0.10 | 0.01 | 1.00 | Fixed position size in lots for each trade. |
| Magic | 5731 | 0 | 9,999,999 | Unique identifier tagging this strategy's positions. |
Note that if the short period is set greater than or equal to the long period, the strategy automatically reduces the short period to keep the fast average strictly faster than the slow one.
Recommended Chart Settings
Range Action Trend Ignition is timeframe- and symbol-agnostic, but its natural home is a trending forex major or metal — for example EURUSD, GBPUSD, or XAUUSD — on intraday-to-swing timeframes in the M30 to H4 range. Because forex price ratios sit near 1, RAVI values are small, which is why the default ignition level is a fraction of a percent (0.30) rather than the roughly 3% Chande originally used on equity indices. If you apply the strategy to instruments with very different price scales, expect to re-tune the threshold. As always, results will vary considerably across different symbols, timeframes, and market conditions, so treat any chart as a starting point for your own testing rather than a fixed recommendation.
How to Install on MetaTrader 5
- Download the .ex5 file from the link below
- Copy it to your MT5
MQL5\Expertsfolder - Restart MetaTrader 5 or refresh the Navigator panel
- Drag the EA onto a chart matching the recommended symbol and timeframe
- Configure the input parameters and enable Algo Trading
What to Consider Before Using This EA
The main strength of this approach is that it is selective. By waiting for a fresh RAVI cross, the strategy tries to enter only when a trend is genuinely emerging from consolidation, which historically tends to be where trend-following moves offer the cleanest structure. The direction filter (close beyond the short SMA) adds a second layer of confirmation, and the ATR-based stops adapt to volatility instead of using fixed pip distances. The ignition-failure exit is a thoughtful risk-control feature that can shorten the life of trades that never develop.
That said, the approach has real limitations you should understand. Like all trend-following systems, it can suffer during extended range-bound or "whipsaw" periods, where RAVI may repeatedly cross the threshold, trigger entries, and then fade — producing a cluster of small losing trades. Moving averages are inherently lagging, so even a well-timed ignition entry arrives after the very first move. The fixed lot size means position risk in currency terms scales with the ATR-based stop distance rather than staying constant, and a single fixed threshold may not suit every instrument or volatility regime. The strategy also holds only one position at a time, so it will not add to a strong trend. None of these are flaws to hide — they are the normal trade-offs of a simple, transparent trend-ignition design, and understanding them is part of the educational value.
Risk Management Tips
- Size positions deliberately. A common educational guideline is to risk no more than 1–2% of account equity on any single trade. Because this EA uses a fixed lot size, calculate what the ATR-based stop distance means in currency terms for your account before going live.
- Test on a demo account first. Run the strategy on a demo or simulated environment across varied market conditions to understand its behavior, trade frequency, and drawdown profile before risking real capital.
- Understand drawdown. Even a sound strategy experiences losing streaks. Know the maximum peak-to-trough decline you are willing to tolerate, and stop to reassess if it is exceeded.
- Diversify and avoid over-optimization. Tuning parameters to fit past data too tightly ("curve fitting") often produces results that fail to carry forward. Prefer robust settings that work reasonably across several conditions.
- Keep records. Logging entries, exits, and the reasoning behind them helps you evaluate whether the strategy behaves as designed rather than relying on impressions.
Risk Warning
Trading foreign exchange, CFDs, and other leveraged financial instruments involves substantial risk of loss and is not suitable for all investors. The strategies and tools discussed on this page are provided for educational purposes only and do not constitute financial advice, investment recommendations, or solicitation to trade. Always consult a qualified financial adviser before making trading decisions. Past backtest performance is not indicative of future results.
Downloads
- Expert Advisor: RangeActionTrendIgnition.ex5 (26 downloads)
- Source Code: RangeActionTrendIgnition.mq5 (25 downloads)
- Documentation: RangeActionTrendIgnition.pdf (31 downloads)