
Disclaimer: This article is for educational and informational purposes only. It does not constitute financial or investment advice. Trading forex and CFDs carries significant risk of loss. Past performance of any strategy — including backtests — does not guarantee future results. Never trade with money you cannot afford to lose.
What Is This Strategy?
The Rank Correlation Trend Pullback strategy is a trend-following, "buy-the-dip" system built around Spearman's rank correlation — a non-parametric statistic that measures how consistently price has climbed or fallen over a window of bars. Spearman's rho works on the order (the ranks) of the closing prices rather than their raw values, so it asks a clean question: "step by step, are prices mostly making progress in one direction?" This makes it a robust, scale-free gauge of whether a genuine trend is in force, and it behaves similarly across symbols, timeframes and volatility regimes without heavy tuning.
Unlike a Pearson (linear) correlation or a regression slope, which reward a straight line and can be distorted by a single violent bar, rank correlation is naturally resistant to outliers. A monotone staircase of higher closes with the occasional shallow pullback still reads near +1, while a lone spike barely shifts a rank. A reading near +1 signals a robust uptrend, a reading near −1 a robust downtrend, and a reading near 0 indicates chop or a range with no clear direction.
This strategy is designed for trending market conditions and is best understood as a learning tool for traders who want to study how a regime filter can be separated from an entry trigger. Here, rank correlation is used only to confirm that a trend exists; the actual timing comes from a pullback-and-reclaim of a short moving-average baseline. It is well suited to intermediate learners exploring non-parametric statistics, ATR-based risk brackets, and the discipline of joining an established trend at a discount rather than chasing it.
How It Works
The strategy evaluates its rules once per completed bar. It measures the trend regime, waits for a shallow pullback against that trend, and then enters only when price reclaims a short baseline. Every decision is framed as a signal — not a promise of outcome.
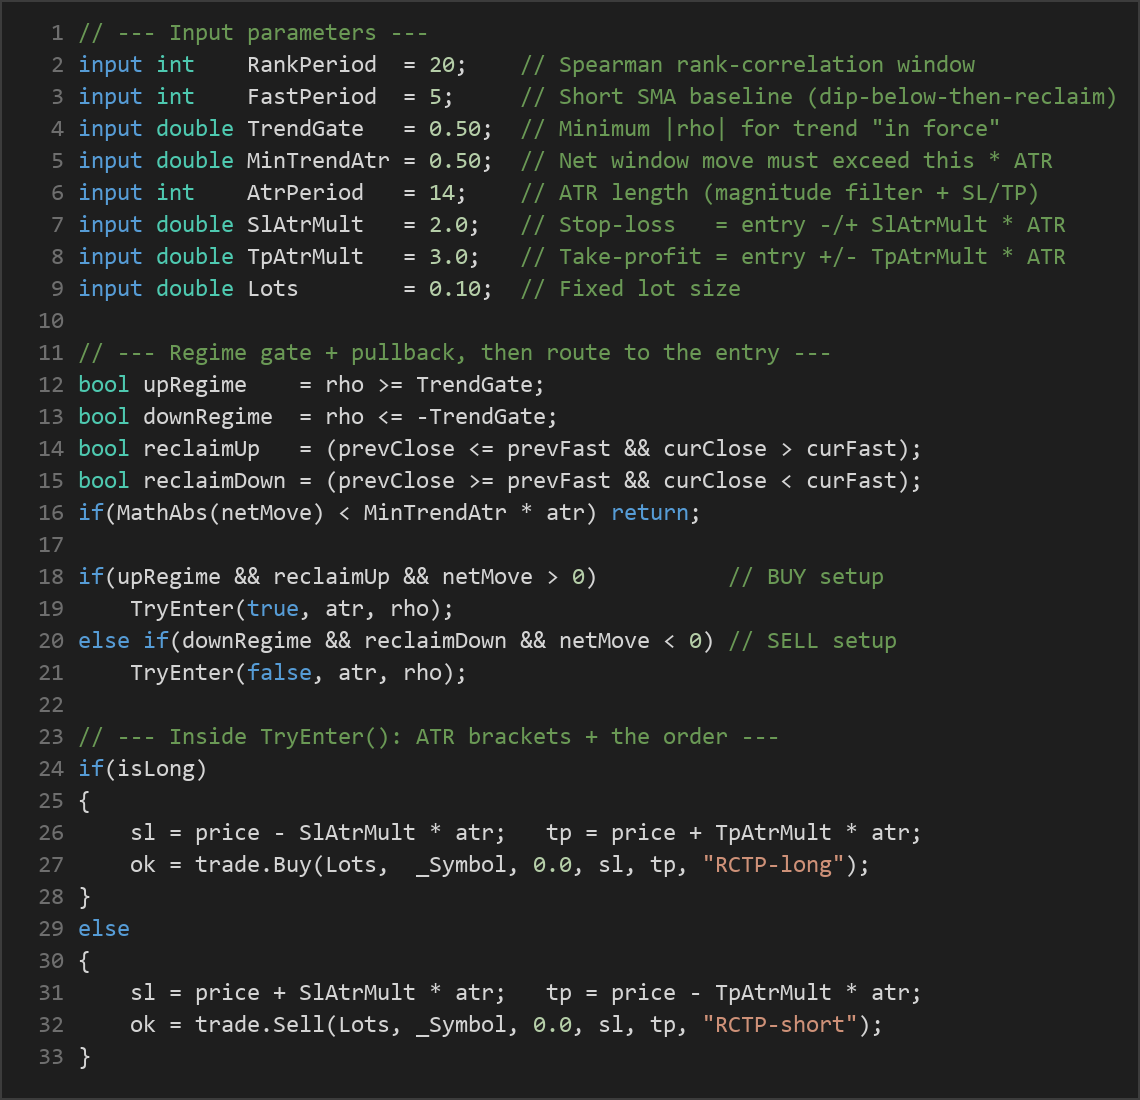
- Trend regime gate (Spearman rho): The strategy computes the rank correlation between the last
RankPeriodcloses and their time order. If rho is at or above+TrendGate, the regime is considered "up." If rho is at or below−TrendGate, the regime is considered "down." If rho sits between those thresholds, no trade is considered. - Magnitude filter (ATR): Because rank correlation can read near ±1 even on a razor-thin drift, the strategy also requires the net price move across the window to exceed
MinTrendAtr × ATR. This confirms the monotone trend has actually covered real ground before any entry is taken. - Long entry signal: In an up regime with sufficient magnitude, the strategy signals a buy when price dips below the fast baseline on the prior bar and then reclaims it on the current bar (previous close ≤ previous fast SMA, and current close > current fast SMA). This is the classic "dip-below-then-reclaim" pullback.
- Short entry signal: In a down regime with sufficient magnitude, the strategy signals a sell when price pops above the fast baseline on the prior bar and is then rejected back below it (previous close ≥ previous fast SMA, and current close < current fast SMA). The rules are symmetric mirror images of each other.
- Stop-loss logic: On entry, a protective stop is placed at a distance of
SlAtrMult × ATRfrom the fill price — below entry for longs, above entry for shorts. Because the stop scales with ATR (Average True Range, a volatility measure), it automatically widens in fast markets and tightens in calm ones. - Take-profit logic: A target is set at
TpAtrMult × ATRfrom entry — above for longs, below for shorts. With defaults of 2.0 for the stop and 3.0 for the target, the built-in reward-to-risk ratio is 1.5-to-1. - Position control: Only one position per magic number is allowed at a time, and sizing is fixed-lot. The strategy runs on a single timeframe — whatever chart it is attached to.

Strategy Parameters
| Parameter | Default | Min | Max | Description |
|---|---|---|---|---|
| RankPeriod | 20 | 8 | 60 | Number of closes used for the Spearman rank-correlation trend gate. Longer windows demand a more sustained trend. |
| FastPeriod | 5 | 2 | 20 | Length of the short SMA baseline that price must dip below then reclaim (or pop above then reject). |
| TrendGate | 0.50 | 0.20 | 0.90 | Minimum absolute rho for a trend to be considered "in force." Higher values demand a more monotone trend. |
| MinTrendAtr | 0.50 | 0.00 | 3.0 | Net window move must exceed this multiple of ATR, filtering out trivial monotone drift. |
| AtrPeriod | 14 | 7 | 30 | ATR length used for the magnitude filter and for stop/target distances. |
| SlAtrMult | 2.0 | 1.0 | 4.0 | Stop-loss distance as a multiple of ATR from the entry price. |
| TpAtrMult | 3.0 | 1.0 | 6.0 | Take-profit distance as a multiple of ATR from the entry price. |
| Lots | 0.10 | 0.01 | 1.0 | Fixed lot size for each position. |
Recommended Chart Settings
The strategy is timeframe-agnostic by design — every calculation references the chart's own timeframe — so it can be studied on whatever period you attach it to. A practical starting point for learning is a liquid major forex pair such as EUR/USD on the H1 (1-hour) or H4 (4-hour) chart, where trends tend to develop cleanly and spreads stay tight. Higher timeframes generally produce fewer, more deliberate signals; lower timeframes produce more frequent but noisier ones.
Because the rank-correlation gate is scale-free, the default parameters are intended to be broadly reasonable rather than optimized for any single instrument. Results will vary considerably across different symbols, timeframes and market conditions, and any settings should be validated on your own data before further study.
How to Install on MetaTrader 5
- Download the .ex5 file from the link below
- Copy it to your MT5
MQL5\Expertsfolder - Restart MetaTrader 5 or refresh the Navigator panel
- Drag the EA onto a chart matching the recommended symbol and timeframe
- Configure the input parameters and enable Algo Trading
What to Consider Before Using This EA
Every strategy has trade-offs, and understanding them is part of using any tool responsibly.
Strengths of this approach:
- Robust trend detection. Rank correlation is inherently resistant to outlier bars and does not depend on the raw scale of prices, so the trend gate tends to behave consistently across instruments and volatility regimes.
- Separation of regime and timing. By using rho only as a gate and a pullback-reclaim for the trigger, the strategy tries to join proven trends at a discount rather than buying strength at its peak.
- Volatility-aware risk. Both the magnitude filter and the stop/target distances scale with ATR, adapting automatically to changing conditions.
- Few, broadly ranged parameters. A small parameter set reduces the surface area for curve-fitting.
Known limitations:
- Range-bound whipsaws. Like all trend-following systems, it can struggle in sideways markets. When rho hovers near the gate, the strategy may take pullback signals that quickly reverse.
- Lagging confirmation. Requiring both a monotone trend and a completed pullback means entries occur after a trend is well established. Sharp, straight-line moves that never pull back may be missed entirely.
- Fixed lot sizing. The default position sizing does not scale to account equity, so risk per trade in currency terms stays constant regardless of balance changes.
- Single-position, single-timeframe design. Only one trade per magic runs at a time, and there is no higher-timeframe context filter, which may leave signals exposed to counter-trend moves on larger scales.
This is a strategy analysis for study, not a recommendation. It may indicate opportunities in trending phases and may underperform in choppy or news-driven conditions.
Risk Management Tips
Sound risk management matters more than any single indicator. Consider these general principles as you study the strategy:
- Risk a small, fixed fraction per trade. Many educators suggest never risking more than 1–2% of account equity on any one position. Since this EA uses fixed lots, calculate what that lot size means in currency terms for your account and adjust accordingly.
- Test on a demo account first. Run the strategy in a risk-free simulated environment for an extended period before considering any live capital, so you can observe how it behaves across different market regimes.
- Understand drawdown. Even a well-built trend system endures losing streaks during ranging markets. Know the maximum peak-to-trough decline you are prepared to tolerate before you begin.
- Mind the reward-to-risk ratio. With default multipliers, the target is 1.5× the stop distance. Study how changing
SlAtrMultandTpAtrMultshifts both your win-rate requirements and your expectancy. - Account for costs. Spreads, commissions and slippage all erode results, especially on lower timeframes where signals are more frequent.
- Never over-leverage. Keep total exposure modest so that a cluster of losing trades cannot threaten your account.
Risk Warning
Trading foreign exchange, CFDs, and other leveraged financial instruments involves substantial risk of loss and is not suitable for all investors. The strategies and tools discussed on this page are provided for educational purposes only and do not constitute financial advice, investment recommendations, or solicitation to trade. Always consult a qualified financial adviser before making trading decisions. Past backtest performance is not indicative of future results.
Downloads
- Expert Advisor: RankCorrelationTrendPullback.ex5 (50 downloads)
- Source Code: RankCorrelationTrendPullback.mq5 (52 downloads)
- Documentation: RankCorrelationTrendPullback.pdf (61 downloads)