
Disclaimer: This article is for educational and informational purposes only. It does not constitute financial or investment advice. Trading forex and CFDs carries significant risk of loss. Past performance of any strategy — including backtests — does not guarantee future results. Never trade with money you cannot afford to lose.
What Is This Strategy?
The Internal Bar Strength Reversion strategy is a counter-trend, mean-reversion system built around Internal Bar Strength (IBS) — a simple, scale-free momentum gauge — combined with an Average True Range (ATR) volatility filter for risk sizing. IBS measures where a candle closes inside its own high-to-low range: a value near 0.0 means price slammed shut on the low of the bar, while a value near 1.0 means it ramped into the high. Because IBS uses only the geometry of a single bar and no absolute price levels or moving averages, it behaves consistently across different currency pairs and timeframes.
Mean reversion is the idea that after a market pushes to a short-term extreme, price often "snaps back" toward a more neutral state. This strategy is designed for range-bound or oscillating market conditions rather than strong, sustained trends. When a market repeatedly closes near the low of each bar, sellers may be exhausting themselves at the edge of the tape, and short-horizon returns historically tend to recover — the mirror logic applies to a market closing near its highs.
As a learning tool, this strategy is well suited to traders who want to study how a pure price-geometry oscillator behaves and how a disciplined "wait for the turn" trigger differs from blindly fading every extreme candle. It is not a shortcut to results; it is a structured example of counter-trend logic with clearly defined, ATR-based risk. Beginners can use it to understand oscillator thresholds, crossing signals, and reward-to-risk exits, while more experienced traders can use it as a framework for parameter experimentation.
How It Works
Rather than fading a single extreme bar — which can keep bleeding as a market trends — the strategy smooths IBS over a short window into an oscillator and waits for that oscillator to cross back out of an extreme zone. That recovery cross is the first sign that internal pressure is releasing, giving a defined turning point instead of trying to catch a falling knife.
The strategy processes one signal per completed bar. Here is what it does:
- Builds the oscillator: For each of the last
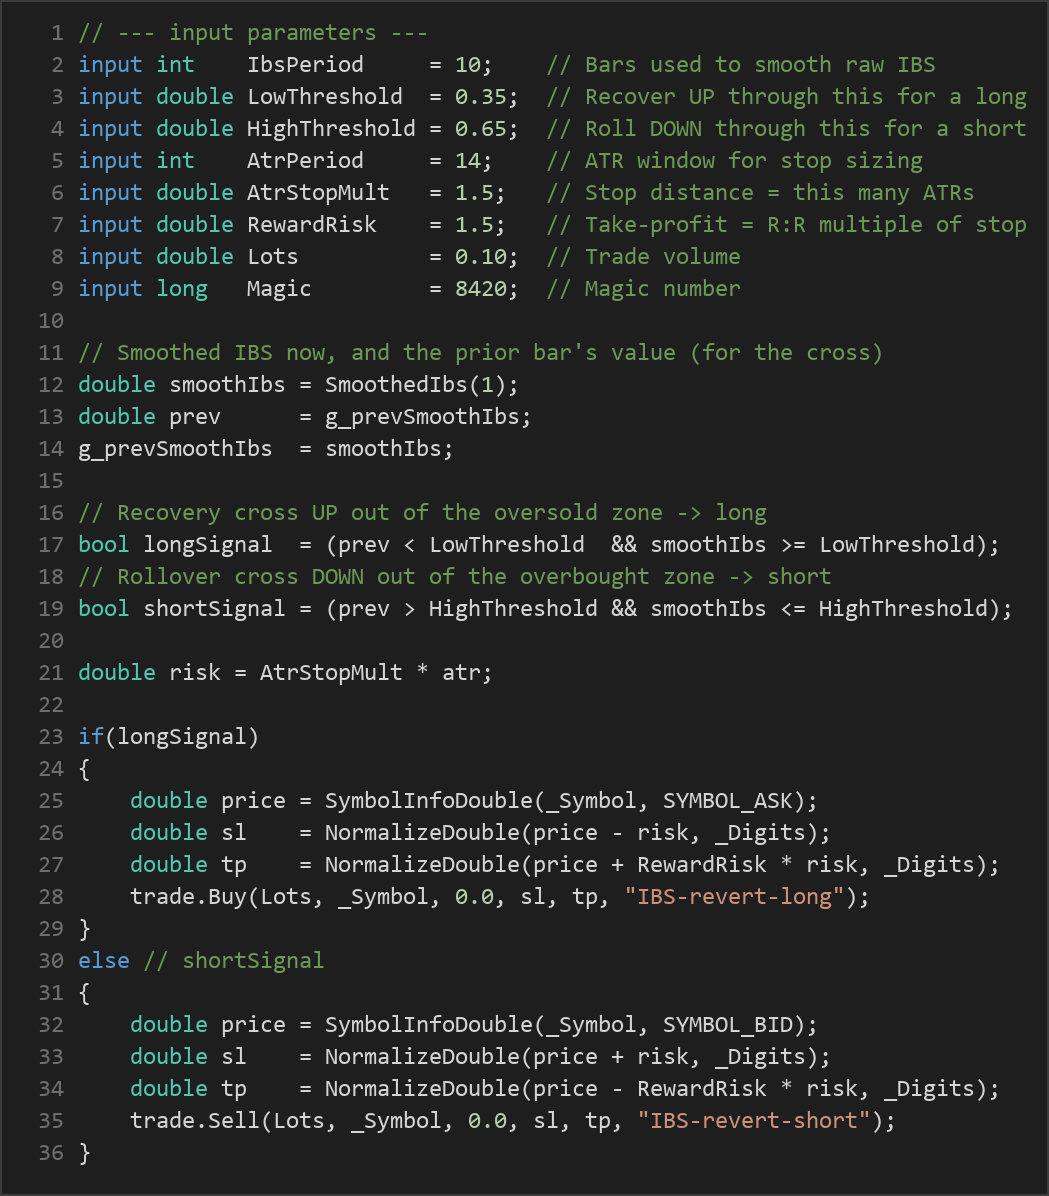
IbsPeriodcompleted bars, it calculates raw IBS = (Close − Low) / (High − Low), then averages those values into a single smoothed reading between 0.0 and 1.0. A flat or degenerate bar (no range) is treated as a neutral 0.5 so it neither pulls the oscillator toward oversold nor overbought. - Long (buy) signal: The strategy signals a long when the smoothed IBS was below the
LowThresholdon the prior bar and has now recovered up through it. This is interpreted as an oversold condition beginning to release. - Short (sell) signal: The strategy signals a short when the smoothed IBS was above the
HighThresholdon the prior bar and has now rolled back down through it — an overbought condition beginning to release. - One position at a time: Only one open position per magic number is allowed. While a trade is live, the strategy does not stack new entries; the stop-loss and take-profit manage the exit.
Stop-loss logic: When a trade is opened, the strategy measures current volatility with ATR and places the stop a fixed number of ATRs away from entry. The stop distance equals AtrStopMult × ATR. For a long, the stop sits below entry; for a short, it sits above. This ties risk to live market volatility rather than a fixed pip count.
Take-profit logic: The take-profit is placed a reward-to-risk multiple of the stop distance away from entry. With the default RewardRisk of 1.5, the target is 1.5 times the stop distance in the favorable direction. If the stop is 30 pips away, the target is 45 pips away. Both the stop and target are set at entry, so each trade has a predefined risk and reward before it begins.
Because entries only fire on the recovery cross and never while a position is already open, the logic stays selective and avoids piling into the same move repeatedly.

Strategy Parameters
| Parameter | Default | Min | Max | Description |
|---|---|---|---|---|
| IbsPeriod | 10 | 3 | 40 | Number of completed bars used to smooth raw IBS into the oscillator. Larger values produce a slower, steadier oscillator; smaller values react faster. |
| LowThreshold | 0.35 | 0.10 | 0.45 | The oversold-zone top. The smoothed oscillator must recover up through this level to trigger a long. Lower values demand a deeper extreme before buying. |
| HighThreshold | 0.65 | 0.55 | 0.90 | The overbought-zone floor. The smoothed oscillator must roll down through this level to trigger a short. Higher values demand a more stretched extreme before selling. |
| AtrPeriod | 14 | 5 | 40 | The look-back window for the ATR calculation used to size the stop-loss. |
| AtrStopMult | 1.5 | 0.5 | 4.0 | Stop distance expressed as this many ATRs from the entry price. Higher values give the trade more room but larger risk per trade. |
| RewardRisk | 1.5 | 0.5 | 5.0 | Take-profit distance as a multiple of the stop distance (reward-to-risk ratio). |
| Lots | 0.10 | 0.01 | 1.0 | Trade volume in lots. Should be sized to your account and risk tolerance. |
Recommended Chart Settings
The Internal Bar Strength Reversion strategy is designed to run on a single timeframe — every calculation uses the chart's primary symbol and period. Because IBS is scale-free, the logic can be applied across major forex pairs, but mean-reversion behavior tends to be more reliable on liquid pairs with clear ranging tendencies, such as EUR/USD, and on intraday-to-swing timeframes like the H1 (1-hour) or H4 (4-hour) charts.
Start by testing the defaults on a single pair and timeframe, then study how the oscillator's threshold crossings line up with actual reversals. Keep in mind that results will vary significantly across different market conditions — a setting that behaves one way in a quiet range may behave very differently during a strong trend or a volatile news period. Always validate any configuration on historical data and a demo account before considering live use.
How to Install on MetaTrader 5
- Download the .ex5 file from the link below
- Copy it to your MT5
MQL5\Expertsfolder - Restart MetaTrader 5 or refresh the Navigator panel
- Drag the EA onto a chart matching the recommended symbol and timeframe
- Configure the input parameters and enable Algo Trading
What to Consider Before Using This EA
Every strategy involves trade-offs. Understanding them is part of trading responsibly.
Strengths of this approach:
- Scale-free and robust: Because IBS uses only the internal geometry of each bar, the oscillator does not depend on absolute price levels, which can make it more portable across pairs and timeframes.
- Defined turning trigger: Waiting for a recovery cross out of an extreme zone is more disciplined than fading every extreme bar, and it gives a clearer point of action.
- Volatility-aware risk: ATR-based stops adapt to current market conditions instead of using a static distance, and every trade carries a predefined reward-to-risk target.
Known limitations:
- Counter-trend by design: Mean-reversion systems tend to struggle in strong, persistent trends, where a market can keep closing near its highs or lows for a long time. In those conditions, the oscillator may generate signals that get stopped out repeatedly.
- Threshold sensitivity: The
LowThresholdandHighThresholdsettings materially change how often and how early signals fire. Overly tight thresholds may over-trade; overly wide ones may rarely trigger. - Single position, single timeframe: The strategy trades one position at a time on one timeframe. It does not use higher-timeframe confirmation, so it may enter against a larger dominant trend.
- No news or session filter: It does not account for high-impact news or thin liquidity periods, which can produce erratic bar geometry.
This is a framework for study and experimentation, not a finished, guaranteed system. Treat it as a starting point for your own research.
Risk Management Tips
Sound risk management matters more than any single entry signal. Consider these general principles:
- Risk a small, fixed fraction per trade. Many educators suggest risking no more than 1–2% of account equity on any single position. Size your
LotsandAtrStopMultso a stop-out stays within that limit. - Understand drawdown. Even a well-designed strategy will have losing streaks. Study the maximum historical drawdown before committing real capital, and ask whether you could tolerate it emotionally and financially.
- Test on a demo account first. Run the EA in a simulated environment to understand its behavior, frequency of trades, and typical stop/target outcomes before considering a live account.
- Diversify and avoid over-leverage. Concentrating too much capital or leverage into one pair or one strategy magnifies risk. Leverage amplifies losses just as much as gains.
- Keep records and review. Track your trades and periodically review whether the strategy's assumptions still hold in current market conditions.
Risk Warning
Trading foreign exchange, CFDs, and other leveraged financial instruments involves substantial risk of loss and is not suitable for all investors. The strategies and tools discussed on this page are provided for educational purposes only and do not constitute financial advice, investment recommendations, or solicitation to trade. Always consult a qualified financial adviser before making trading decisions. Past backtest performance is not indicative of future results.
Downloads
- Expert Advisor: InternalBarStrengthReversion.ex5 (51 downloads)
- Source Code: InternalBarStrengthReversion.mq5 (51 downloads)
- Documentation: InternalBarStrengthReversion.pdf (57 downloads)