Disclaimer: This article is for educational and informational purposes only. It does not constitute financial or investment advice. Trading forex and CFDs carries significant risk of loss. Past performance of any strategy — including backtests — does not guarantee future results. Never trade with money you cannot afford to lose.
What Is This Strategy?
The Turning Point Density Breakout is a regime-gated breakout strategy built around a nonparametric randomness measure called the turning-point density, paired with a classic price breakout trigger. In plain terms, it counts how often recent closing prices reverse direction, uses that count to judge whether the market is genuinely trending or just chopping sideways, and only then looks for a breakout to trade in the direction the trend is already leaning. It is designed for the MetaTrader 5 platform and runs as an Expert Advisor (EA) on a single symbol and timeframe.
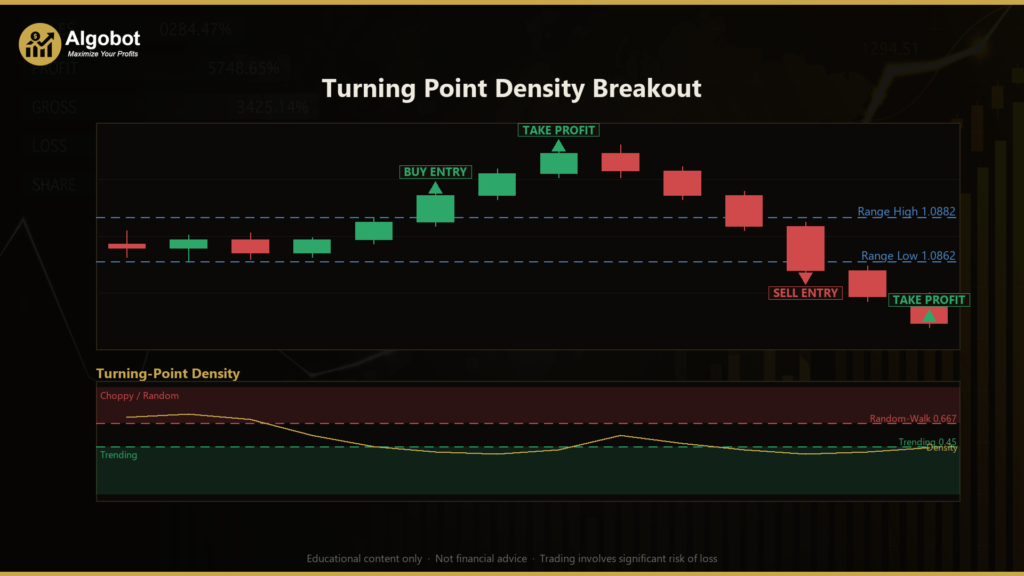
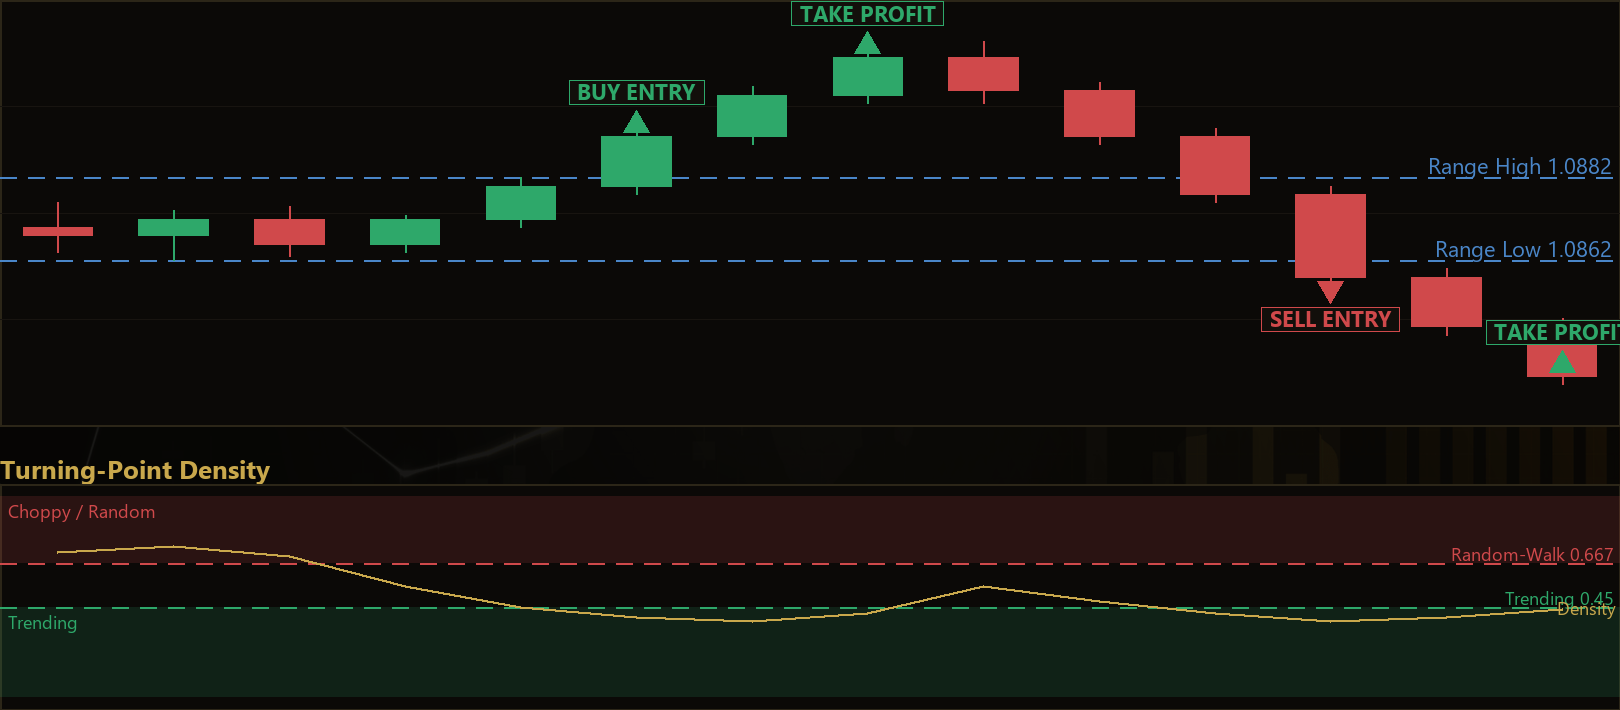
A "turning point" is a local peak or trough — a close that is higher than both of its neighbours (a peak) or lower than both (a trough). Statistical theory tells us that for a pure random walk, about two-thirds (≈0.667) of interior points will be turning points, because a directionless market constantly flips back and forth. When a market trends smoothly, consecutive closes push the same way and the turning-point density collapses well below that 0.667 baseline. The strategy treats a low density as the signature of a clean, low-noise directional regime — the kind of environment where a breakout is more likely to follow through than to trap traders.
This EA is best understood as a learning tool for studying regime detection and breakout confirmation, not as a shortcut to results. It is suitable for traders who want to explore how a simple statistical test can filter breakout signals, and who are comfortable studying, backtesting, and demo-testing an approach before ever considering live capital. If you are new to breakout systems or to the idea of filtering trades by market "regime," this strategy offers a compact, transparent example of both ideas working together.
How It Works
The strategy acts once per completed bar and combines a regime filter, a direction check, and a breakout trigger. All three must agree before it acts. Here is the logic step by step:
- Measure the regime. Over the last
Windowcloses, the strategy counts how many interior closes are turning points (peaks or troughs) and divides by the number of interior points. This ratio is the turning-point density. - Confirm a trending regime. If the density is at or below
MaxDensity, the market is considered smooth and directional (trending). If the density sits above that threshold, the tape is treated as choppy and no trade is taken. - Determine direction. The strategy measures net displacement — the newest close minus the oldest close inside the window. A positive value points the regime long; a negative value points it short.
- Require a fresh breakout. For a long signal, the just-closed bar must close above the highest high of the prior
BreakoutBarsbars. For a short signal, it must close below the lowest low of that prior window. This ensures the entry is triggered by a genuine break of recent structure, not just a favourable statistic. - Combine all conditions. A long entry needs a trending regime and upward net displacement and an upside breakout. A short entry needs the mirror image. If any piece disagrees, the strategy stands aside.
For managing trades already open, the logic is deliberately conservative:
- Regime flip exits. If the strategy is holding a long position and a fully confirmed short signal appears (or vice versa), it closes the existing position and steps aside, re-entering only on a later bar. This treats an opposite signal as evidence the regime has turned.
- No stacking. The strategy never adds a second position in the same direction. One position at a time keeps exposure simple and predictable.
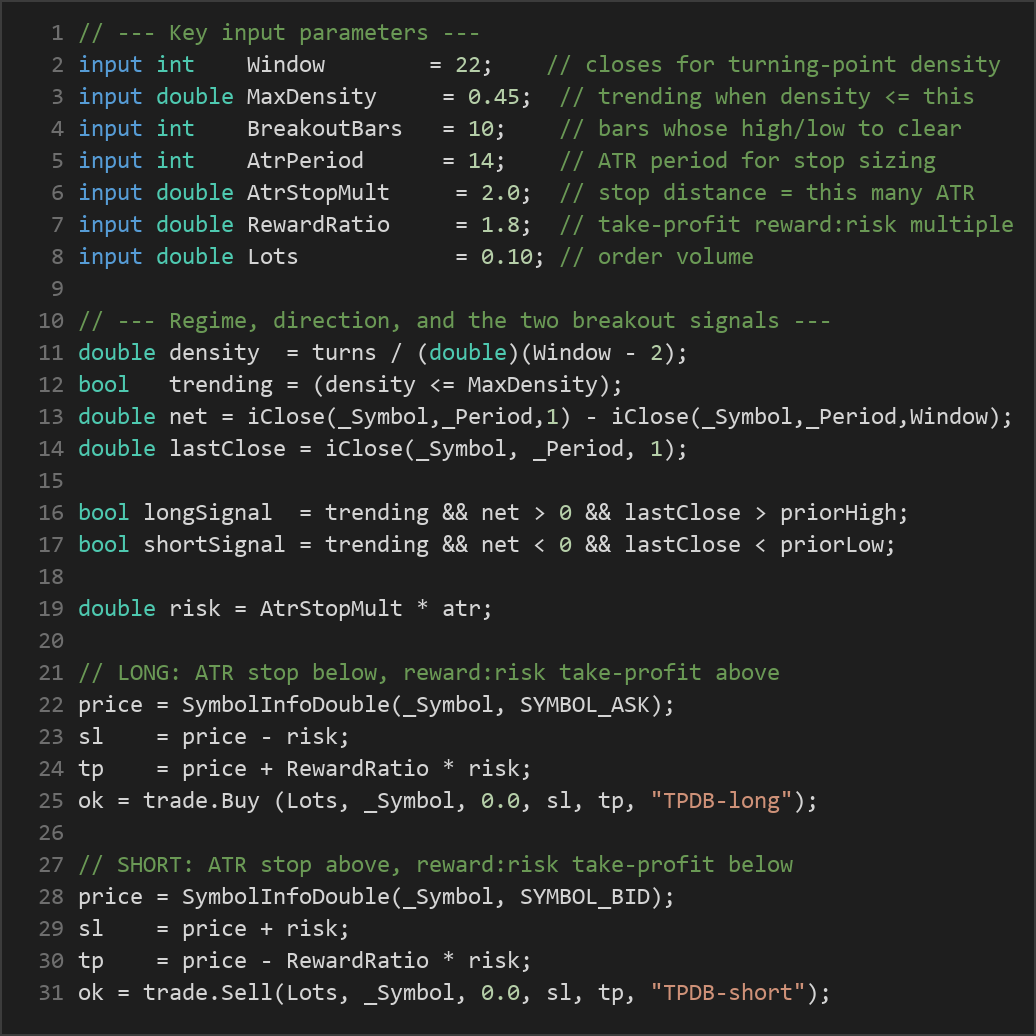
- Stop-loss logic. Every entry is protected by an ATR-based stop. The Average True Range (ATR) is a volatility measure; the stop distance is set to
AtrStopMultmultiplied by the current ATR, so the stop automatically widens in volatile conditions and tightens in calm ones. - Take-profit logic. The take-profit is placed at a reward-to-risk multiple of the stop distance, defined by
RewardRatio. With the defaults, the target is 1.8 times the risk taken on each trade.
Strategy Parameters
| Parameter | Default | Min | Max | Description |
|---|---|---|---|---|
| Window | 22 | 10 | 60 | Number of recent closes over which the turning-point density is measured. Larger values smooth the regime read; smaller values react faster. |
| MaxDensity | 0.45 | 0.25 | 0.62 | Density threshold for a trending regime. A trade is allowed only when density is at or below this. 0.667 is the random-walk baseline, so values below it demand a genuinely smooth, low-reversal tape. |
| BreakoutBars | 10 | 4 | 30 | Number of prior bars whose highest high or lowest low the trigger bar must clear to confirm a breakout. |
| AtrPeriod | 14 | 7 | 30 | Lookback period for the ATR used to size the stop-loss. |
| AtrStopMult | 2.0 | 1.0 | 4.0 | Stop-loss distance expressed as a multiple of ATR. Higher values give the trade more room but risk more per trade. |
| RewardRatio | 1.8 | 1.0 | 3.0 | Take-profit distance as a reward-to-risk multiple of the stop distance. |
| Lots | 0.10 | 0.01 | 1.0 | Fixed order volume in lots for each entry. |
Recommended Chart Settings
The Turning Point Density Breakout was designed to operate on a single symbol and a single timeframe — every calculation uses the chart's own timeframe. A common starting point for studying breakout systems like this is a major forex pair such as EUR/USD on an intraday timeframe like the H1 (1-hour) chart, where there is enough bar structure for the density and breakout windows to be meaningful without excessive noise.
That said, the "best" symbol and timeframe are something you should establish for yourself through testing rather than assume. Turning-point density and breakout behaviour differ substantially between fast-moving pairs, ranging pairs, and different session hours. Results will vary across instruments, timeframes, and market conditions, so treat any default as a research starting point, not a recommendation.
How to Install on MetaTrader 5
- Download the .ex5 file from the link below
- Copy it to your MT5
MQL5\Expertsfolder - Restart MetaTrader 5 or refresh the Navigator panel
- Drag the EA onto a chart matching the recommended symbol and timeframe
- Configure the input parameters and enable Algo Trading
What to Consider Before Using This EA
Every strategy has trade-offs, and being honest about them is part of using one responsibly.
Strengths. The regime filter is the distinctive idea here. By requiring the turning-point density to fall below a threshold before any breakout is taken, the strategy tries to avoid the classic failure mode of breakout systems — being whipsawed inside a choppy range. The turning-point test is nonparametric, meaning it makes no assumption about the distribution of returns, which is appealing for messy real-world price data. The logic is also symmetric and transparent: long and short rules mirror each other, and every decision is explainable.
Known limitations. Breakout strategies as a family tend to produce many small losing trades punctuated by occasional larger winners; the reward-to-risk target is built around that reality, but it also means win rates can feel low even when the approach is behaving as designed. The turning-point density is a lagging measure — by the time a trend is smooth enough to register, part of the move may already be spent. The strategy can also flip in and out of positions when signals reverse, which may increase transaction costs from spread and commission.
Where it may underperform. In violently choppy or news-driven markets, false breakouts can still slip through even when the density filter is engaged. In very slow, tightly ranging conditions, the density may rarely drop below the threshold, so the EA may sit idle for long stretches. And in sharply mean-reverting markets, a confirmed breakout can reverse quickly, hitting the ATR stop. None of these are flaws in the code — they are simply the market conditions this style of system finds difficult.
Risk Management Tips
Regardless of the strategy, disciplined risk management matters more than any single parameter setting. Consider these general principles as you study this EA:
- Size positions to your account. A common guideline is to risk no more than 1–2% of account equity on any single trade. The fixed
Lotsinput does not automatically scale to your balance, so calculate what each trade actually risks given your stop distance. - Test on a demo account first. Run the strategy on a demo account across different market conditions before considering any live use. This lets you observe behaviour without financial exposure.
- Understand drawdown. Every strategy experiences losing streaks. Know how large a drawdown you could tolerate emotionally and financially, and study the historical drawdown of any configuration you test.
- Account for costs. Spread, commission, and slippage all erode results, especially in a strategy that may flip positions. Include realistic costs in any backtest.
- Change one thing at a time. When tuning parameters, adjust a single input and observe its effect rather than changing several at once, so you can understand what each control actually does.
Risk Warning
Trading foreign exchange, CFDs, and other leveraged financial instruments involves substantial risk of loss and is not suitable for all investors. The strategies and tools discussed on this page are provided for educational purposes only and do not constitute financial advice, investment recommendations, or solicitation to trade. Always consult a qualified financial adviser before making trading decisions. Past backtest performance is not indicative of future results.
Downloads
- Expert Advisor: TurningPointDensityBreakout.ex5 (47 downloads)
- Source Code: TurningPointDensityBreakout.mq5 (47 downloads)
- Documentation: TurningPointDensityBreakout.pdf (52 downloads)