
Disclaimer: This article is for educational and informational purposes only. It does not constitute financial or investment advice. Trading forex and CFDs carries significant risk of loss. Past performance of any strategy — including backtests — does not guarantee future results. Never trade with money you cannot afford to lose.
What Is This Strategy?
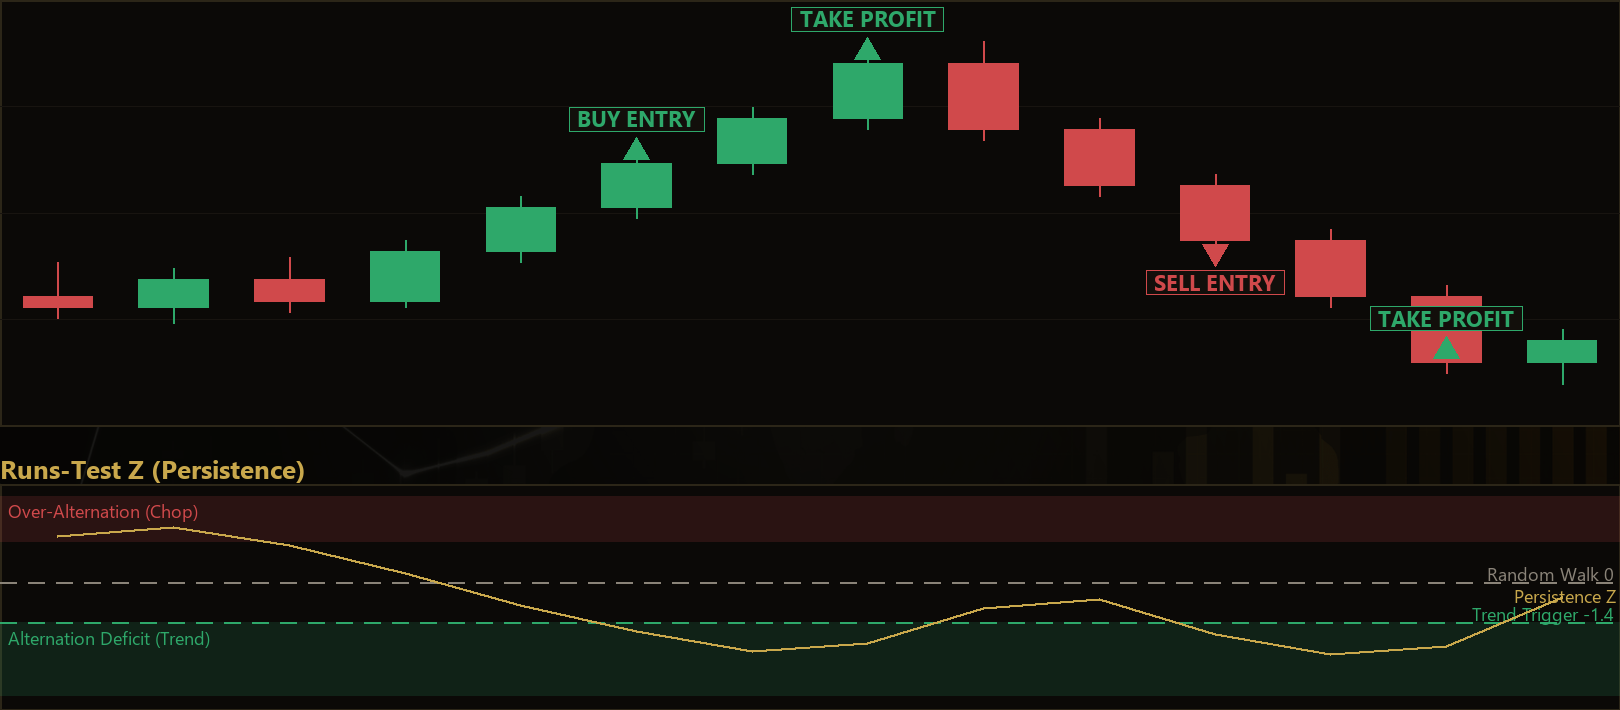
The Alternation Deficit Trend strategy is a non-parametric, trend-following Expert Advisor (EA) built around the Wald–Wolfowitz runs test — a classic statistical tool for measuring whether a sequence is random or clustered. Instead of relying on a moving average crossover or a conventional oscillator, this approach converts recent price action into a string of plus and minus signs (up-close versus down-close) and then asks a precise question: are these signs clustering into streaks more than pure chance would allow? When they do, the strategy interprets that clustering as evidence of genuine directional persistence — in other words, a trend.
The core idea rests on a concept called an "alternation deficit." If price behaved like a fair coin — a random walk with no memory — you would expect signs to flip back and forth a predictable number of times. When there are noticeably fewer direction changes than randomness predicts, the market is producing long same-direction streaks, which historically signals a trending regime. The strategy standardizes this observation into a Z-score (a measure of how many standard deviations an outcome sits from the random expectation) and only commits to a trade when that score crosses a significance threshold.
As a learning tool, this EA is well suited to traders who want to understand how statistical hypothesis testing can be applied to markets rather than pattern recognition alone. It is a trend regime detector at heart: it is designed to stand aside during choppy, over-alternating conditions and to engage only when directional memory is measurably present. Traders studying regime filtering, non-parametric statistics, or systematic trend following will find it a useful case study.
How It Works
The strategy evaluates conditions once per newly completed bar. It builds a rolling window of recent closing prices, converts consecutive changes into directional signs, and runs the statistical test before deciding whether to act.
Entry conditions — the strategy signals a trade only when all of the following align:
- Runs deficit confirmed. Over the last
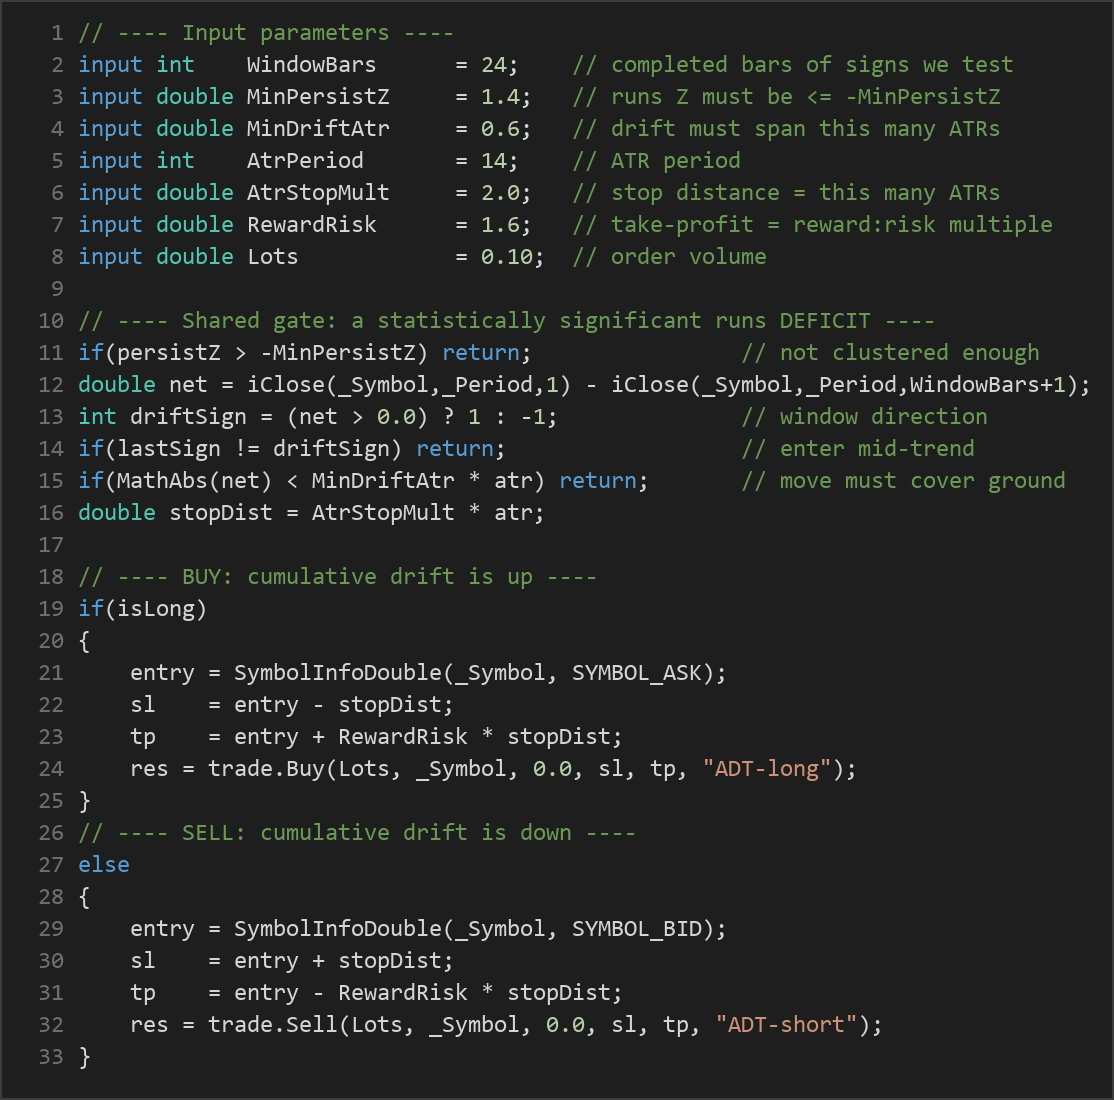
WindowBarsclose-to-close changes, the EA counts up-moves, down-moves, and "runs" (maximal streaks of one sign). It computes the standardized runs statisticZ = (runs − mu) / sqrt(var). A significant deficit — whereZis at or below−MinPersistZ— indicates the signs are clustering more than randomness would explain, which may indicate a real trend. A one-sided window (all up or all down) is treated as maximal persistence. - Sufficient directional samples. At least six non-flat directional moves must exist in the window, so the normal approximation behind the runs statistic remains meaningful. Flat (unchanged) closes are ignored.
- Drift direction set. The cumulative close change across the window determines direction: a net rise signals a long bias, a net fall signals a short bias.
- Move covers real ground. The absolute cumulative drift must span at least
MinDriftAtrmultiplied by the current ATR (Average True Range, a volatility measure). This filters out flat clusters that technically pass the runs test but have not actually travelled. - Momentum agreement. The most recent directional sign must agree with the overall drift, so the EA enters mid-trend rather than on a fresh counter-swing.
Additional gating filters:
- Only one position per magic number is held at a time; the stop-loss and take-profit manage the exit.
- If the current spread exceeds
MaxSpreadPoints, the trade is skipped to reflect realistic fill conditions (set to 0 to disable this filter).
Stop-loss logic: Once a trade is triggered, the stop distance is set to AtrStopMult × ATR. For a long, the stop sits below entry; for a short, above entry. Anchoring the stop to ATR lets it adapt to current volatility instead of using a fixed pip distance.
Take-profit logic: The target is placed at a RewardRisk multiple of the stop distance. With the default reward:risk of 1.6, the take-profit sits 1.6 times further from entry than the stop, defining the trade's intended payoff geometry before the position is opened.
Strategy Parameters
| Parameter | Default | Min | Max | Description |
|---|---|---|---|---|
| WindowBars | 24 | 10 | 60 | Number of completed bars whose close-to-close signs are tested for clustering. |
| MinPersistZ | 1.4 | 0.5 | 3.0 | The runs-test Z must be at or below this negative threshold; larger values demand stronger statistical proof of a trend. |
| MinDriftAtr | 0.6 | 0.0 | 3.0 | Minimum cumulative drift over the window, measured in ATRs, required to confirm the move has travelled. |
| AtrPeriod | 14 | 5 | 40 | Lookback period for the ATR used in stop, target, and drift-distance calculations. |
| AtrStopMult | 2.0 | 0.5 | 5.0 | Stop-loss distance expressed as a multiple of ATR. |
| RewardRisk | 1.6 | 0.5 | 4.0 | Take-profit distance as a reward:risk multiple of the stop distance. |
| MaxSpreadPoints | 30 | 0 | 200 | Maximum allowable spread (in points) to permit a new trade; 0 disables the filter. |
| Lots | 0.10 | 0.01 | 1.0 | Fixed order volume in lots. |
Recommended Chart Settings
The Alternation Deficit Trend EA operates on a single timeframe — every calculation uses the chart's primary timeframe. Because the runs test needs a meaningful sample of directional moves, intraday timeframes such as M15, M30, or H1 on a liquid major pair like EUR/USD or GBP/USD are reasonable starting points for study. Higher timeframes produce fewer but more considered signals, while lower timeframes generate more signals with more noise.
Bear in mind that a statistical trend filter behaves differently across instruments and market conditions. Results will vary between trending and ranging environments, and between low- and high-volatility periods. Treat any chosen symbol and timeframe as a starting hypothesis to be examined in the Strategy Tester and on a demo account, not as a fixed recommendation.
How to Install on MetaTrader 5
- Download the .ex5 file from the link below.
- Copy it to your MT5
MQL5\Expertsfolder. - Restart MetaTrader 5 or refresh the Navigator panel.
- Drag the EA onto a chart matching the recommended symbol and timeframe.
- Configure the input parameters and enable Algo Trading.
What to Consider Before Using This EA
Strengths of this approach. The strategy's defining advantage is its regime filter. Trend-following systems historically bleed capital during choppy, over-alternating markets, and this EA is explicitly built to sit out those periods. By requiring a statistically significant runs deficit before committing, it only engages when directional persistence is measurably present. The non-parametric nature of the runs test also means it makes few assumptions about the distribution of returns, which can make it more robust than tools tuned to a specific market shape. ATR-based stops and targets add volatility awareness rather than fixed distances.
Known limitations. No statistical filter is infallible. The runs test detects past clustering; it cannot know whether a trend will continue, and trends can end the moment the EA enters. The MinSamples requirement and normal approximation mean the test is more reliable with larger windows, yet larger windows react more slowly to regime shifts — a genuine trade-off. Because the EA holds one position at a time with a fixed reward:risk, it cannot pyramid into a strong trend or scale out. The fixed lot size does not adapt to account equity.
Where it may underperform. Sharp, news-driven reversals can trigger stops even when the runs test reads as trending. Very quiet, low-volatility ranges may repeatedly fail the MinDriftAtr filter, producing long stretches with no trades. Whipsaw conditions — where a trend appears statistically valid but reverses quickly — remain the hardest environment for any trend follower, and this EA is no exception. It is a tool for studying regime-gated trend entries, not a solution for all market conditions.
Risk Management Tips
Sound risk management matters more than any single entry signal. Consider the following educational principles:
- Position sizing. Rather than defaulting to a fixed lot size, size positions relative to your account. A common guideline is to risk no more than 1–2% of account equity per trade, calculated from the ATR-based stop distance.
- Understand drawdown. Every strategy experiences losing streaks. Study the maximum historical drawdown in the Strategy Tester so you understand the capital swings you may need to tolerate.
- Test on a demo account first. Run the EA on a demo account across varied market conditions before considering any live deployment. This builds familiarity with how often it trades and how it behaves in ranges versus trends.
- Respect leverage. Leverage amplifies both gains and losses. Use it conservatively and be aware of margin requirements.
- Diversify and review. Avoid concentrating risk in a single instrument or correlated pairs, and review performance regularly rather than setting and forgetting.
Risk Warning
Trading foreign exchange, CFDs, and other leveraged financial instruments involves substantial risk of loss and is not suitable for all investors. The strategies and tools discussed on this page are provided for educational purposes only and do not constitute financial advice, investment recommendations, or solicitation to trade. Always consult a qualified financial adviser before making trading decisions. Past backtest performance is not indicative of future results.
Downloads
- Expert Advisor: AlternationDeficitTrend.ex5 (53 downloads)
- Source Code: AlternationDeficitTrend.mq5 (54 downloads)
- Documentation: AlternationDeficitTrend.pdf (64 downloads)