Disclaimer: This article is for educational and informational purposes only. It does not constitute financial or investment advice. Trading forex and CFDs carries significant risk of loss. Past performance of any strategy — including backtests — does not guarantee future results. Never trade with money you cannot afford to lose.
What Is This Strategy?
The Trend Intensity Index Breakout is a trend-following breakout strategy built around the Trend Intensity Index (TII), a momentum-conviction indicator originally described by M.H. Pee. Where most trend filters simply ask "which way is the moving average pointing?", the Trend Intensity Index asks a sharper question: of the recent price action, how one-sided is it around its own mean? That focus on conviction rather than raw slope is what defines this particular trading style — it waits for the market to show committed, one-directional pressure before it acts.
Under the hood, the strategy looks back over a window of recent bars and measures how far each closing price sat above or below a simple moving average (SMA) calculated as of that bar. It pools all the "above-the-mean" distances into one bucket and all the "below-the-mean" distances into another, then expresses the result on a 0-to-100 scale. A reading near 50 means price mass is split evenly around the mean — indecision, or "chop." A push toward 100 means almost all recent action sits above the mean (an intense up-move), while a collapse toward 0 means the opposite. The Trend Intensity Index therefore behaves as a pure conviction gauge that is independent of the trend's direction.
As a learning tool, this strategy suits traders who want to study how breakout confirmation differs from breakout prediction. It is designed for markets that trend cleanly in bursts — liquid FX pairs such as EURUSD or GBPUSD, or a metal like XAUUSD (gold). Because it derives everything from the chart's primary timeframe, it can be studied on whatever timeframe you attach it to, though it was built with the higher intraday timeframes in mind. Treat it as a framework for understanding intensity-based entries, not as a shortcut to results.
How It Works
The strategy evaluates its logic once per newly closed bar, so signals are stable and do not repaint intrabar. Each cycle it computes the Trend Intensity Index at the latest completed bar and at the bar before it, allowing it to detect the moment a fresh cross occurs rather than merely whether intensity is high.
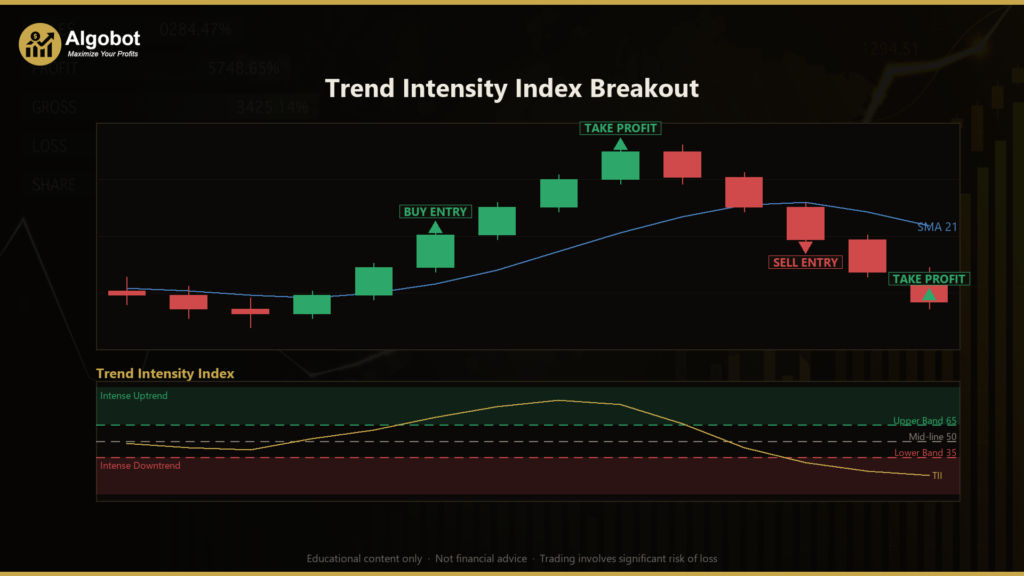
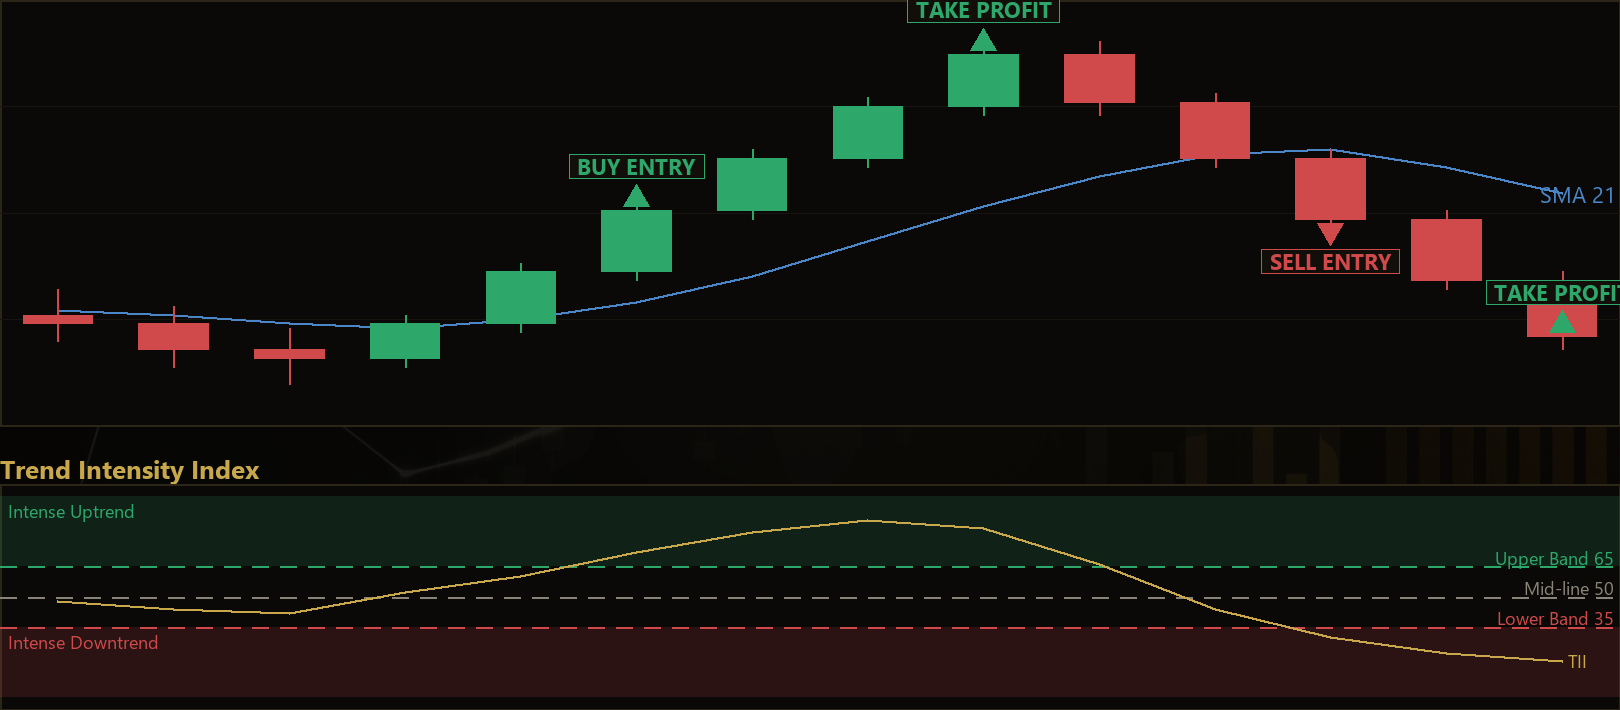
Entry conditions — a fresh "ignition" of intensity:
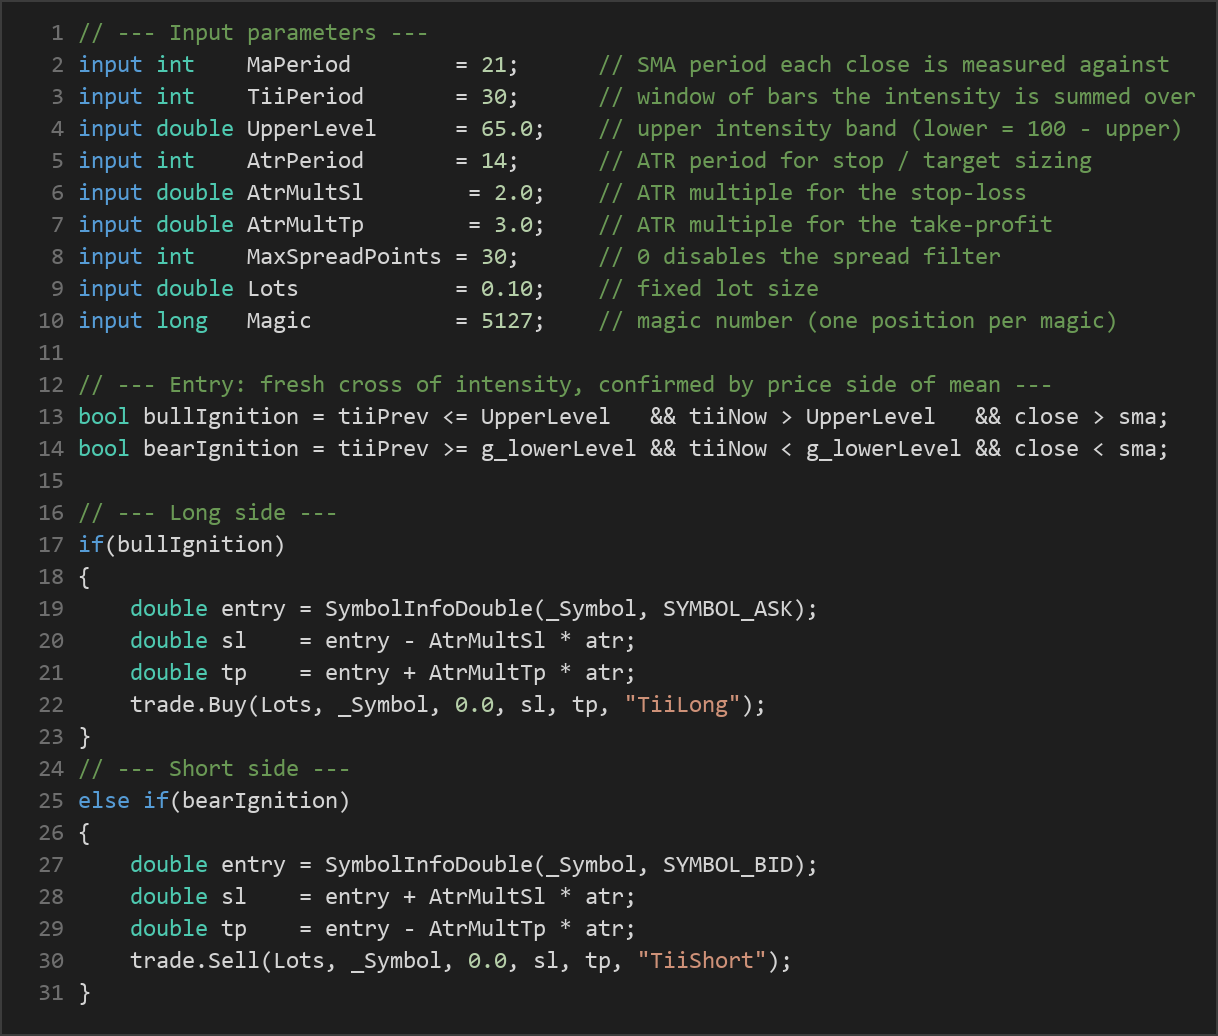
- Buy signal: the Trend Intensity Index crosses up through the
UpperLevelband and the latest close is above its SMA. This combination indicates that one-directional buying pressure has just ignited and price confirms it by sitting above the mean. - Sell signal: the Trend Intensity Index crosses down through the
LowerLevelband and the latest close is below its SMA. TheLowerLevelis the mirror of the upper band (100 − UpperLevel), so the long and short legs are perfectly symmetric. - A signal requires a genuine crossing — intensity that was on one side of the band on the previous bar and has moved past it on the current bar. Simply being above the band is not enough; the strategy is looking for the transition.
Confirmation and filters:
- Spread filter: if the current spread exceeds
MaxSpreadPoints, the strategy skips the entry to keep fills realistic. Setting this to 0 disables the filter. - One position per magic number: only a single position is held at a time under the strategy's identifier, avoiding stacked exposure.
Exit logic — two symmetric layers:
- Hard ATR stop and target: every trade is opened with a stop-loss and take-profit derived from the Average True Range (ATR), a volatility measure. The stop sits
AtrMultSl × ATRaway from entry and the target sitsAtrMultTp × ATRaway. This caps risk on each individual trade and lets position sizing scale with current volatility. - Trend-neutralisation exit: the position is closed early if the Trend Intensity Index crosses back through the 50 mid-line against the trade. For a long, that means intensity has fallen from above 50 to below it; for a short, the reverse. The idea is that once the conviction that justified the entry has evaporated, the strategy releases the trade rather than waiting for the hard stop.
Because the entry demands a fresh cross and price confirmation, while the exit watches for that same conviction to dissolve, the whole system is organised around a single question: is the market still pushing one-sidedly, or not?
Strategy Parameters
| Parameter | Default | Min | Max | Description |
|---|---|---|---|---|
| MaPeriod | 21 | 5 | 80 | Period of the simple moving average each close is measured against when building the intensity reading. |
| TiiPeriod | 30 | 8 | 90 | Number of bars the Trend Intensity Index sums deviations over — the conviction window. |
| UpperLevel | 65.0 | 52.0 | 90.0 | Upper intensity band for a bullish ignition; the lower band is automatically set to 100 − this value. |
| AtrPeriod | 14 | 5 | 40 | Period of the ATR used to size the stop-loss and take-profit. |
| AtrMultSl | 2.0 | 0.5 | 6.0 | ATR multiple that sets how far the stop-loss sits from entry. |
| AtrMultTp | 3.0 | 0.5 | 10.0 | ATR multiple that sets how far the take-profit sits from entry. |
| MaxSpreadPoints | 30 | 0 | 200 | Maximum allowed spread (in points) for a new entry; 0 disables the filter. |
| Lots | 0.10 | 0.01 | 1.0 | Fixed trade size in lots for every position. |
Recommended Chart Settings
This strategy was designed for liquid instruments that produce clean, sustained trends interrupted by periods of chop — the exact environment the Trend Intensity Index is meant to distinguish between. Well-suited candidates include major FX pairs such as EURUSD and GBPUSD, and XAUUSD (gold). The logic reads only the primary timeframe of whatever chart it is attached to, and it was conceived with the H1 and H4 timeframes in mind, where intensity swings are meaningful and signal frequency is manageable.
As always, behaviour changes with the instrument and market regime. A parameter set that looks reasonable on one pair or timeframe may behave very differently on another, so treat the defaults as a starting point for study rather than a finished configuration. Results will vary across different market conditions.
How to Install on MetaTrader 5
- Download the .ex5 file from the link below
- Copy it to your MT5
MQL5\Expertsfolder - Restart MetaTrader 5 or refresh the Navigator panel
- Drag the EA onto a chart matching the recommended symbol and timeframe
- Configure the input parameters and enable Algo Trading
What to Consider Before Using This EA
Strengths of the approach. The Trend Intensity Index Breakout is disciplined about when it participates. By requiring a fresh crossing of the band plus price agreement with the mean, it filters out many low-conviction moves that a simple moving-average cross would take. The dual exit — a volatility-scaled hard stop plus an intensity-based neutralisation — gives it a defined maximum risk while still allowing an early, logic-driven exit when the trend loses its push. Its symmetric long/short construction means it treats both directions identically, which makes its behaviour easier to study and reason about.
Known limitations. Like all breakout systems, it is vulnerable to false breakouts — bars where intensity briefly ignites and then immediately reverses, triggering the neutralisation exit for a small loss. In choppy, range-bound markets the Trend Intensity Index can oscillate around the mid-line, producing a series of entries that are stopped or neutralised in quick succession. The strategy also acts only on closed bars, so it accepts a small amount of lag in exchange for signal stability. Because it holds a single fixed lot size regardless of account equity, position sizing does not adapt to your balance out of the box.
Where it may underperform. Extended sideways ranges, low-volatility drift, and news-driven whipsaws are the hardest conditions for any intensity breakout. During such periods you may see more frequent small losses as the strategy repeatedly tests for a trend that never sustains. It is best understood as a tool for participating in trends once they demonstrate conviction — not for anticipating them, and not for grinding through range-bound noise. Study its behaviour across several market regimes before drawing any conclusions.
Risk Management Tips
Sound risk management matters far more than any single indicator. As you study this strategy, keep these general principles in mind:
- Size positions conservatively. A common educational guideline is to risk no more than 1–2% of account equity on any single trade. The default fixed-lot setting does not do this automatically, so calculate what a full ATR-stop loss would mean for your account before committing capital.
- Always use the stop-loss. The ATR stop is the strategy's primary risk control; never disable it or move it further away to avoid being stopped out.
- Test on a demo account first. Run the EA on a demo or in the Strategy Tester across multiple instruments and market conditions before considering anything else. This is where learning happens without financial consequences.
- Understand drawdown. Every strategy experiences losing streaks. Know the maximum drawdown you are willing to tolerate and how a run of consecutive losses would affect your account.
- Diversify your study. Do not judge a strategy on a handful of trades. A larger sample across different regimes gives a far more honest picture of how it behaves.
Approach this EA as a structured way to learn how intensity-based breakout logic works, not as a substitute for your own judgement and risk discipline.
Risk Warning
Trading foreign exchange, CFDs, and other leveraged financial instruments involves substantial risk of loss and is not suitable for all investors. The strategies and tools discussed on this page are provided for educational purposes only and do not constitute financial advice, investment recommendations, or solicitation to trade. Always consult a qualified financial adviser before making trading decisions. Past backtest performance is not indicative of future results.
Downloads
- Expert Advisor: TrendIntensityIndexBreakout.ex5 (34 downloads)
- Source Code: TrendIntensityIndexBreakout.mq5 (34 downloads)
- Documentation: TrendIntensityIndexBreakout.pdf (37 downloads)