Disclaimer: This article is for educational and informational purposes only. It does not constitute financial or investment advice. Trading forex and CFDs carries significant risk of loss. Past performance of any strategy — including backtests — does not guarantee future results. Never trade with money you cannot afford to lose.
What Is This Strategy?
The Projection Band Trend Pullback strategy is a trend-continuation system built around Projection Bands and the Projection Oscillator, two tools introduced by Mel Widner in Stocks & Commodities magazine (1995). Unlike fixed-width channels such as Bollinger Bands or Donchian channels, projection bands are slope-aware: they fit a least-squares regression line through recent highs and another through recent lows, then tilt the channel in the direction the market is actually moving. The result is an envelope that tracks a trend rather than fighting it.
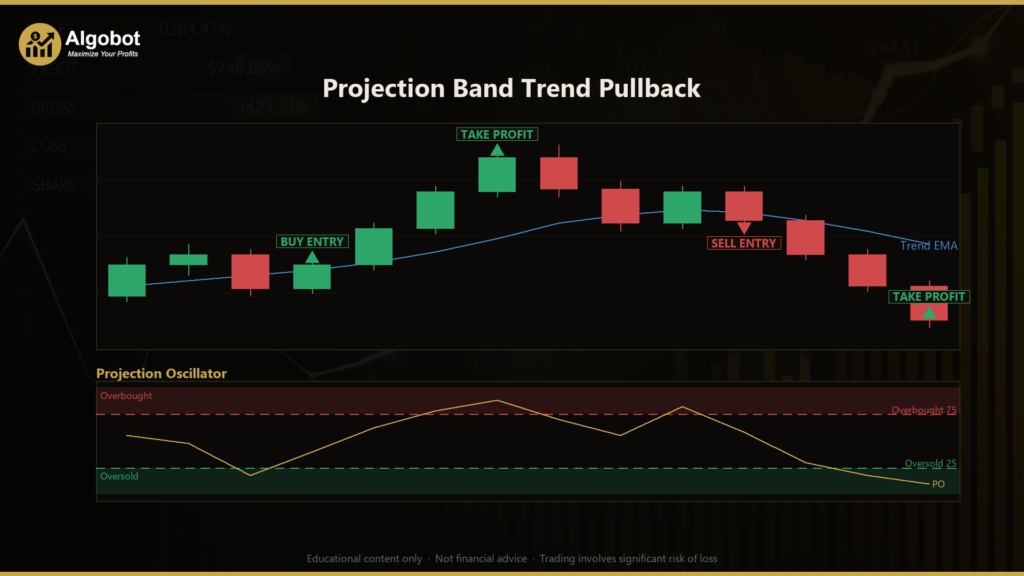
At the heart of the system sits the Projection Oscillator (PO), a value between 0 and 100 that measures where the current price sits inside the slanted channel. In that sense it behaves like a trend-adjusted Stochastic %K. When price retraces toward the lower band during an uptrend, the oscillator sinks toward "oversold." Because the channel is already tilted upward, that oversold reading represents a genuine within-trend discount — a pullback — rather than a reversal signal.
This is a pullback-continuation approach, not a breakout system. It is designed for liquid, trending instruments such as major forex pairs, gold, and stock indices on intraday-to-swing timeframes. As a learning tool, it is well suited to traders who want to study how regression-based channels differ from static bands, and how an oscillator can be combined with a trend filter to time entries into an existing move. Frame your study of it as strategy analysis — understanding why each rule exists — rather than as a shortcut to results.
How It Works
The strategy evaluates its rules only once per bar, acting on the candle that has just closed. It first constructs the projection bands over a rolling window of ProjPeriod bars, then derives the oscillator and checks the trend filter before considering any trade.
Building the bands and oscillator:
- A least-squares regression slope is fitted separately to the highs and to the lows over the window.
- Every past high is slid forward to the current bar along its own slope, and the maximum becomes the Upper band. The same is done for lows, and the minimum becomes the Lower band.
- The Projection Oscillator is calculated as
PO = 100 × (Close − Lower) / (Upper − Lower), clamped between 0 and 100.
The trend filter:
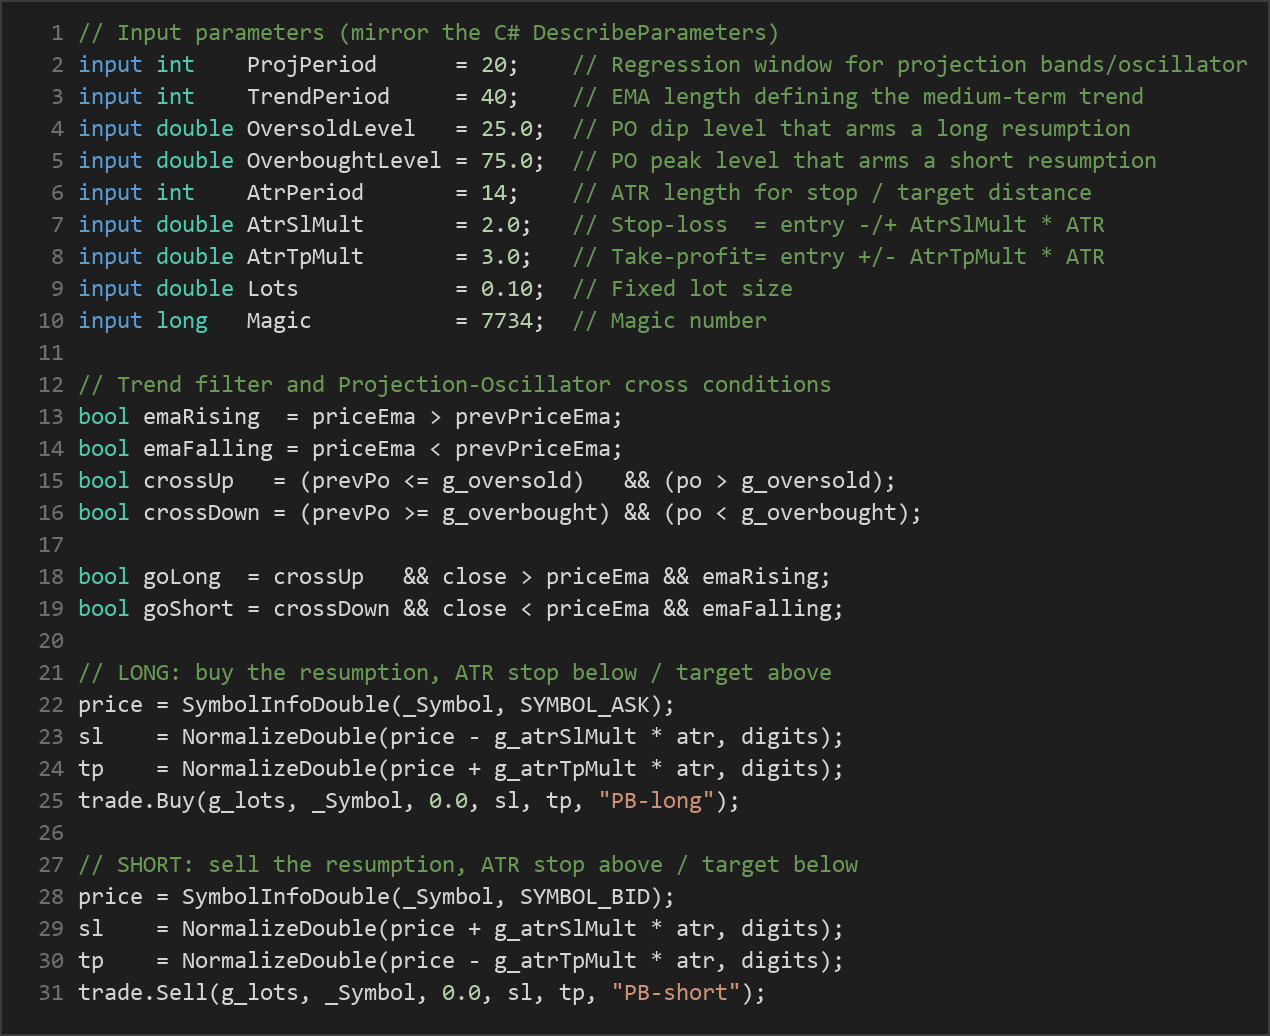
- An Exponential Moving Average (EMA) of length
TrendPerioddefines the medium-term trend. An EMA weights recent prices more heavily than older ones. - The trend is considered up when the close is above the EMA and the EMA is rising; down when the close is below a falling EMA.
Long entry — the strategy signals a buy when all of these hold:
- Trend is up (close above a rising EMA).
- On the prior bar, the oscillator was at or below the
OversoldLevel(a pullback occurred). - On the current bar, the oscillator has crossed back up above the
OversoldLevel(the move is resuming).
Short entry — the exact mirror of the long rules:
- Trend is down (close below a falling EMA).
- On the prior bar, the oscillator was at or above the
OverboughtLevel. - On the current bar, the oscillator has crossed back down below the
OverboughtLevel.
Exit, stop-loss, and take-profit logic:
- Position sizing is a fixed lot size, and only one position per magic number may be open at a time.
- The stop-loss is placed at a distance of
AtrSlMult × ATRfrom the entry price. ATR (Average True Range) is a volatility measure, so the stop automatically widens in volatile conditions and tightens in calm ones. - The take-profit is placed at
AtrTpMult × ATRfrom entry. With the defaults, the target sits farther away than the stop, giving a reward-to-risk ratio greater than 1. - Each position simply runs to its stop-loss or take-profit; there is no separate trailing or time-based exit.
Strategy Parameters
| Parameter | Default | Min | Max | Description |
|---|---|---|---|---|
| ProjPeriod | 20 | 8 | 60 | Regression window (in bars) used to build the projection bands and oscillator. |
| TrendPeriod | 40 | 15 | 120 | EMA length that defines the medium-term trend direction. |
| OversoldLevel | 25.0 | 10.0 | 40.0 | Oscillator dip level that arms a long resumption entry. |
| OverboughtLevel | 75.0 | 60.0 | 90.0 | Oscillator peak level that arms a short resumption entry. |
| AtrPeriod | 14 | 7 | 30 | ATR length used to size the stop-loss and take-profit distances. |
| AtrSlMult | 2.0 | 1.0 | 4.0 | Stop-loss distance as a multiple of ATR. |
| AtrTpMult | 3.0 | 1.0 | 6.0 | Take-profit distance as a multiple of ATR. |
| Lots | 0.10 | 0.01 | 1.0 | Fixed trade size in lots. |
The parameter ranges are deliberately wide. This is intentional: broad ranges make it easier to study how the strategy behaves across settings and help resist over-fitting to any single historical period.
Recommended Chart Settings
This strategy was designed for liquid, trending instruments — major forex pairs (such as EUR/USD or GBP/USD), gold (XAU/USD), and major stock indices. It operates on a single timeframe: whatever chart timeframe you attach it to is the timeframe it trades. Intraday-to-swing horizons such as the H1 (1-hour) or H4 (4-hour) charts are a reasonable starting point for study, since they give trends room to develop while still producing enough pullbacks to observe.
Keep in mind that no single symbol or timeframe is universally "correct." Results and behavior will vary considerably across different market conditions, instruments, and time periods, so treat any setting as a starting point for your own research rather than a fixed recommendation.
How to Install on MetaTrader 5
- Download the
.ex5file from the link below. - Copy it to your MT5
MQL5\Expertsfolder. - Restart MetaTrader 5 or refresh the Navigator panel.
- Drag the EA onto a chart matching the recommended symbol and timeframe.
- Configure the input parameters and enable Algo Trading.
What to Consider Before Using This EA
Strengths of this approach. The main appeal of projection bands is that they adapt to trend slope. A static channel can flag price as "overbought" simply because the market is trending strongly, generating premature counter-trend signals. By tilting the channel with the regression slope, the Projection Band Trend Pullback strategy aims to identify pullbacks within a trend instead. Pairing the oscillator with an EMA trend filter also means the system only acts in the direction of the prevailing move, which can help avoid trading against momentum. The ATR-based stops adapt to changing volatility rather than using a fixed pip distance.
Known limitations. Every trend-following idea shares the same weakness: it struggles in ranging or choppy markets. When there is no sustained direction, the EMA can whipsaw between rising and falling, and pullback signals may lead into failed continuations. Regression-based bands also lag by nature, since they are computed from historical bars — the slope reflects where the market has been, which may not persist. Because entries require an oscillator cross plus a trend confirmation plus an EMA slope condition, valid signals can be relatively infrequent, and the strategy may sit idle for long stretches. Finally, the fixed take-profit and stop-loss mean a strong trend can reverse before the target is reached, or a target can cap a move that would have continued much further.
Where it may underperform. Expect the weakest behavior during low-volatility consolidations, news-driven spikes that violate the volatility assumptions of the ATR stop, and sharp reversals where a "pullback" turns out to be the start of a genuine trend change. Studying these failure modes on historical data is, arguably, the most valuable thing this EA can teach.
Risk Management Tips
Sound risk management matters far more than any single entry signal. Consider these general principles as you study the strategy:
- Risk a small fraction per trade. A widely cited guideline is to risk no more than 1–2% of your account on any single position. Set your lot size so that the distance to the stop-loss represents that small percentage, rather than trading a fixed lot blindly.
- Understand drawdown. Even a well-designed strategy will experience losing streaks. Know how large a peak-to-trough decline you could tolerate — both financially and emotionally — before you commit real capital.
- Test on a demo account first. Run the EA on a demo account across varied market conditions to observe how it behaves before considering any live use. This costs nothing and teaches a great deal.
- Account for costs. Spreads, commissions, and slippage all erode results, especially on shorter timeframes with frequent trading. Factor them into any evaluation.
- Never over-leverage. Leverage amplifies losses as readily as gains. Use it conservatively, and never trade with money you cannot afford to lose.
Risk Warning
Trading foreign exchange, CFDs, and other leveraged financial instruments involves substantial risk of loss and is not suitable for all investors. The strategies and tools discussed on this page are provided for educational purposes only and do not constitute financial advice, investment recommendations, or solicitation to trade. Always consult a qualified financial adviser before making trading decisions. Past backtest performance is not indicative of future results.
Downloads
- Expert Advisor: ProjectionBandTrendPullback.ex5 (16 downloads)
- Source Code: ProjectionBandTrendPullback.mq5 (14 downloads)
- Documentation: ProjectionBandTrendPullback.pdf (23 downloads)